
Knowledge Graph Export
Graphviz turns your worksheet data into a picture. Relationship Visualizer can now also turn that same data into a Knowledge Graph: a structured JSON document meant to be handed to an AI tool rather than rendered as an image.
This isn't a separate tool bolted onto the side. The Knowledge Graph runs from the exact same worksheet data as the diagram pipeline, resolving labels, tooltips, and styles through the same inheritance rules. Set a default at the graph, node, or edge level (or within a cluster), and individual rows only need to specify what's different, exactly like they do today for diagrams. Because both outputs share one resolution engine, the JSON export and the diagram it corresponds to are guaranteed to agree with each other.
What is a Knowledge Graph?
A Knowledge Graph represents information as nodes and typed relationships rather than prose. Where a diagram is built for a human eye, a JSON Knowledge Graph is built for a machine to traverse. An AI tool can follow a chain of connections and answer questions about your data instead of guessing at them from unstructured text.
Curious what this looks like in practice? I Let an AI Read My Knowledge Graph walks through handing one to two different AI models, cold, and checking their answers edge by edge.
The Diagram Isn't Going Anywhere
Exporting a Knowledge Graph doesn't mean giving up the diagram. Both outputs come from the same worksheet, and you can generate either one independently, or produce both together, along with the raw DOT source, in a single publish.
The Data Ribbon Tab
Generating and publishing a Knowledge Graph is handled from the Data ribbon tab, alongside the same controls used to generate and publish Graphviz diagrams.
Visualize the Knowledge Graph
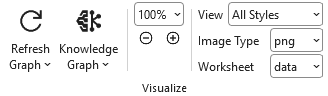 |
Press the Knowledge Graph button dropdown to build the current view as JSON and open it in the built-in viewer.
Since Excel has no native way to display JSON, the export opens in your default browser rather than in a worksheet cell. The viewer itself lives inside the workbook as a hidden worksheet, so there's no companion file to lose track of, and it behaves identically on Windows and macOS.
Two mutually exclusive modes control how the viewer opens:
- Refresh a single, shared browser tab each time you regenerate the graph.
- Open a fresh tab every time.
If you're using the shared-tab mode and accidentally close the browser tab, a "reopen" option in the same dropdown brings it back without regenerating anything.
Publish the Knowledge Graph
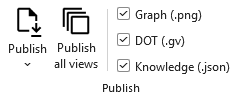 |
The Publish split button includes three checkboxes: Graph, DOT, and Knowledge. Check any combination and a single click of Publish (or Publish all views) writes a matched set of output files from the same run which can include:
- A rendered diagram to eyeball.
- The raw DOT source fed to Graphviz.
- The Knowledge Graph JSON ready to hand off to AI.
Open the split button's dropdown (the small v arrow) to enable "Open after publishing" if you want the JSON viewer to open automatically once the file is written.
The Knowledge Graph JSON Viewer
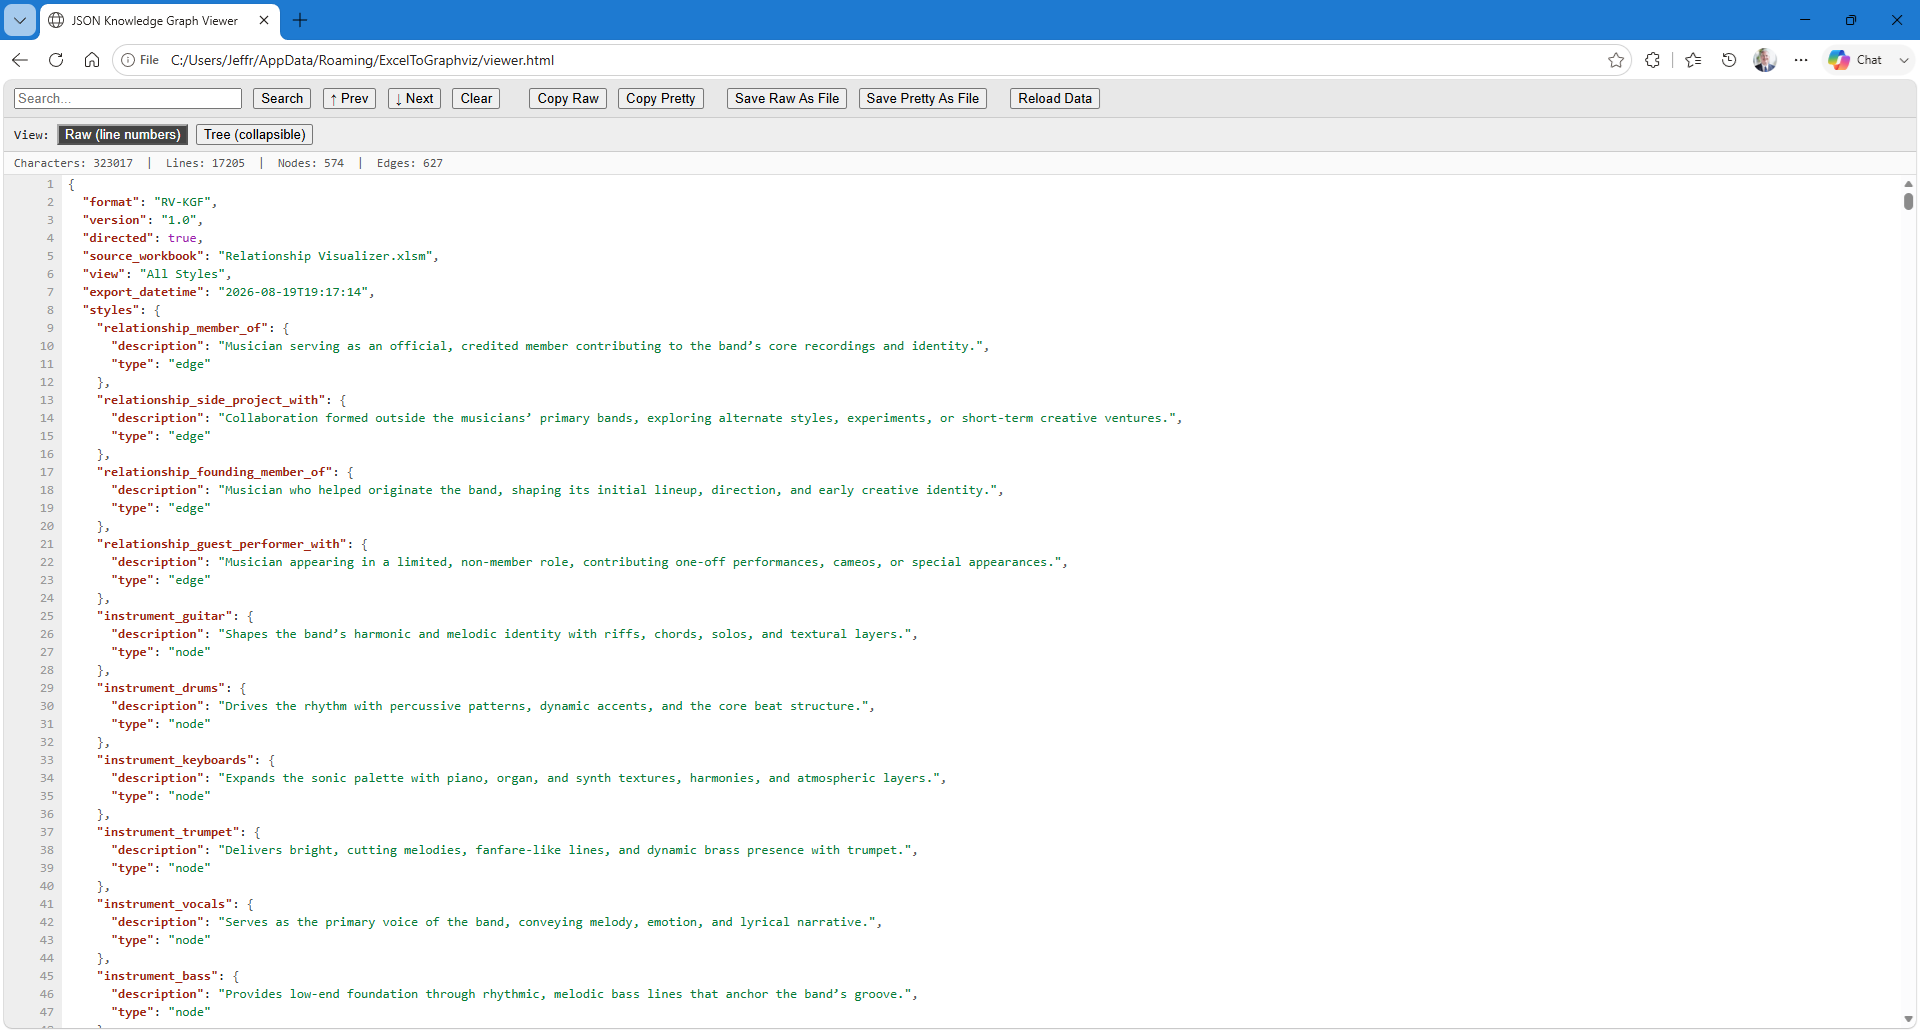
The built-in viewer supports two ways of reading the export:
| Text View |
|---|
 |
| Tree View |
|---|
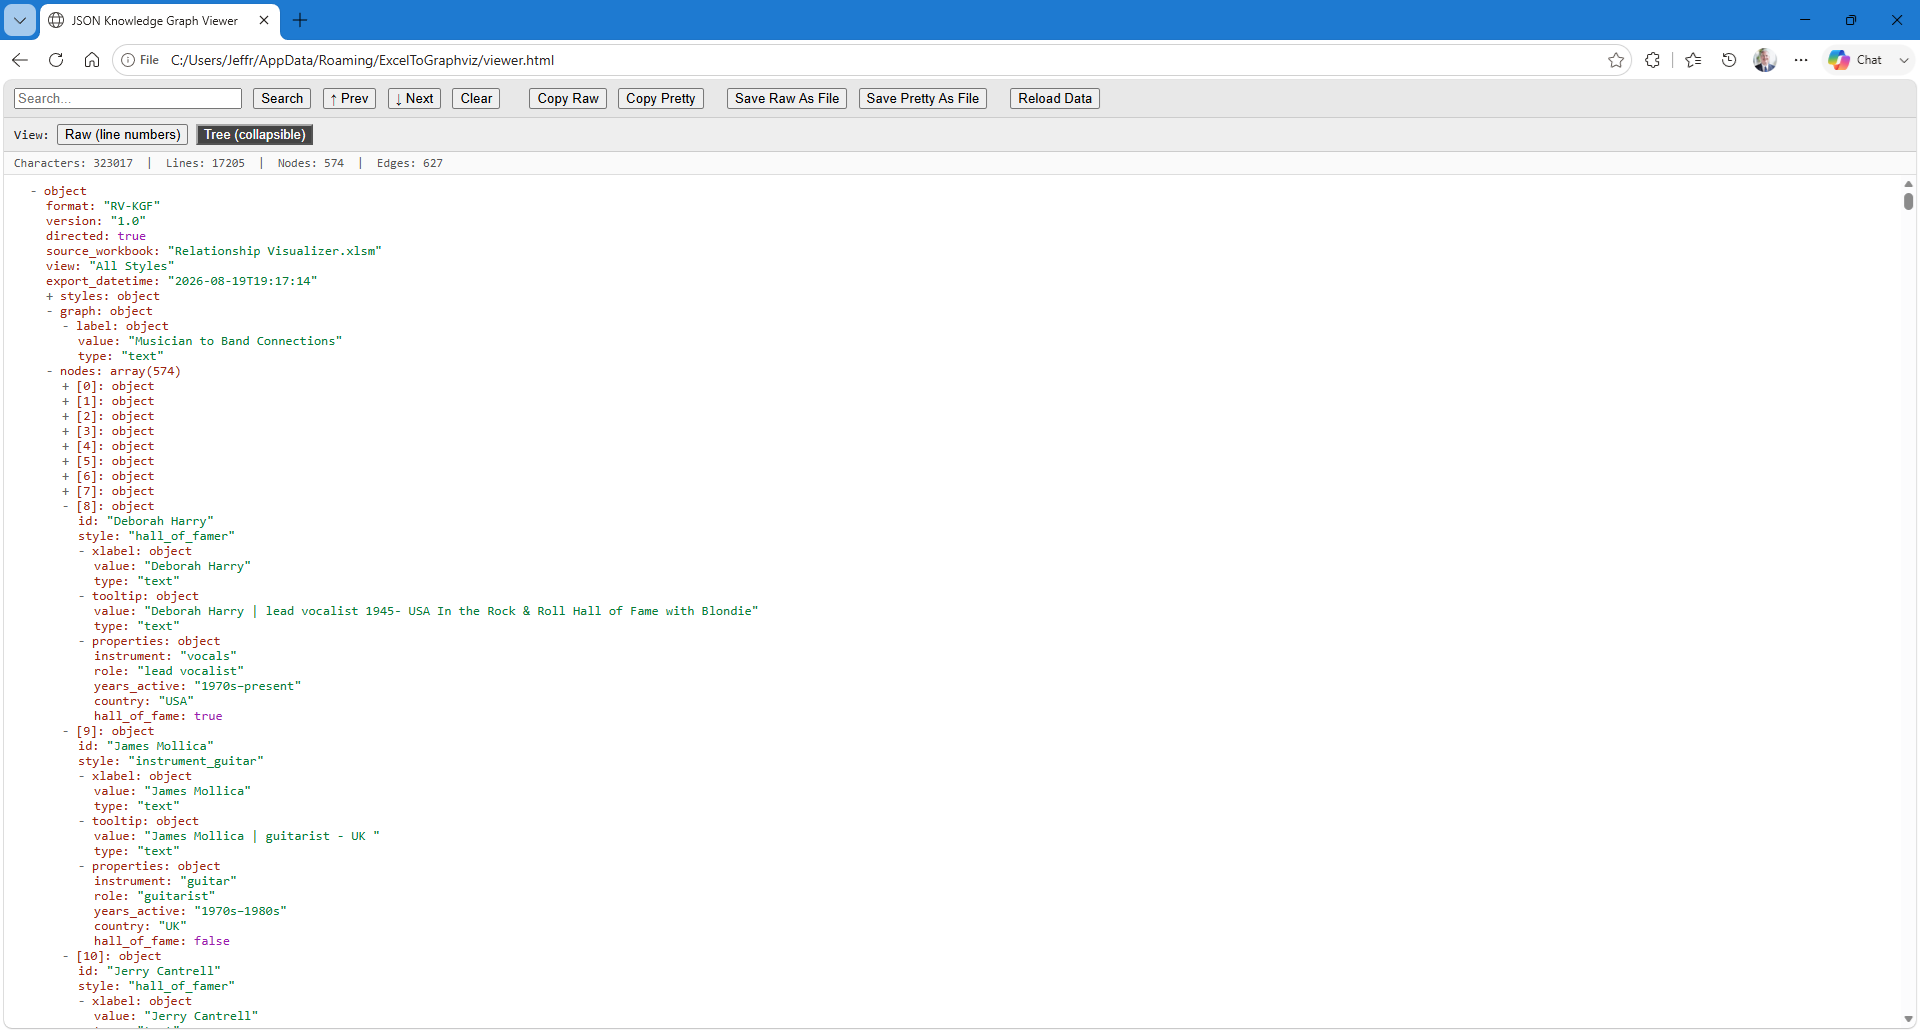 |
Raw text is the default. Toggle to the tree view to collapse and expand levels of the graph. The viewer also supports text search, copy to clipboard, and saving to a file.
Check the Size Before You Paste
The status bar shows a live character count and estimated LLM token count for the current export, so you know roughly what it will cost before pasting it into an AI tool with a limited context window.
The RV-KGF Schema
The Relationship Visualizer – Knowledge Graph Format (RV‑KGF) schema is fully documented independent of this website. The complete specification is available at: github.com/jjlong150/rv-kgf.
What's in the Export
Each Knowledge Graph export includes:
- Metadata containing format and version, whether the graph is directed, the source workbook and view name, and an export timestamp.
- A trimmed styles section listing only the node, edge, and cluster styles actually in use, keeping the file smaller and easier for an AI tool to work with.
- Inherited labels and tooltips, following the same graph → node/edge → row precedence used for diagrams.
- Automatic edge fan-out - a single row with a comma-separated list of sources or targets expands into multiple discrete edges.
- Automatic placeholders for nodes referenced before they're formally defined, filled in once the real definition is reached.
- A clear warning, instead of silent data loss, for any row using native DOT passthrough syntax, since that has no JSON representation.
Typed, Arbitrary Properties
Beyond the built-in label, tooltip, and style fields, every node and edge can carry its own free-form Properties which are arbitrary key/value pairs read from a Properties column on the data worksheet.
Write them the same way you'd write extra Graphviz attributes: space-, comma-, or semicolon-separated key=value pairs, with quotes around any value containing spaces or punctuation.
weight=200 domestic=true opened=2019-03-14 contribution="buy me a coffee"That row comes out as a real number, a real boolean, a date-valued string, and a quoted string, not everything flattened to plain text:
"properties": {
  "weight": 200,
  "domestic": true,
  "opened": "2019-03-14",
  "contribution": "buy me a coffee"
}
Dates are deliberately kept as validated ISO‑8601 strings rather than converted to true date values as doing the conversion through the export's time‑zone handling could otherwise shift a date‑only value back a day for anyone west of Greenwich.
Properties follow the same graph → node/edge → row inheritance as labels and tooltips, so you can set a default once at the node[] or edge[] level and override it only where it needs to differ.
Example: A Node in the Knowledge Graph
Here's what a single node looks like in an actual export. The Tooltip built for a human, and the Properties built for a machine, both drawn from the same worksheet row:
    {
      "id": "Eric Clapton",
      "style": "hall_of_famer",
      "xlabel": {
        "value": "Eric Clapton",
        "type": "text"
      },
      "tooltip": {
        "value": "Eric Clapton | guitarist 1945- UK  In the Rock & Roll Hall of Fame with The Yardbirds (1992), Cream (1993), & as a solo artist (2000).",
        "type": "text"
      },
      "properties": {
        "born": 1945,
        "instrument": "guitar",
        "role": "guitarist",
        "years_active": "1960s-present",
        "country": "UK",
        "hall_of_fame": true,
        "hall_of_fame_with": "The Yardbirds (1992), Cream (1993), & as a solo artist (2000)."
      }
    },
Publishing from SQL
If you drive graph generation with SQL queries, two PUBLISH directives route query results straight to a Knowledge Graph instead of a diagram:
PUBLISH AS KNOWLEDGE GRAPHpublishes the current view as JSON.PUBLISH ALL VIEWS AS KNOWLEDGE GRAPHdoes the same for every defined view, producing one JSON file per view.
Scaling Tips for Large Graphs
A few things help when a graph gets large enough that context-window limits start to matter:
- Keep style names short. Every node and edge references its style by name, and that name repeats once per element that uses it.
- Filter before you export, not after. Use a
WHEREclause, or a View that filters out styles you don't need, to scope the export to the slice of the graph you actually want analyzed. - Check the token estimator before you paste. The viewer's status bar shows a running character count and token estimate.
- Prefer AI tools with larger context windows for very large graphs, if one truncates your export, that's a signal to shrink it, not necessarily a dead end.
These tips are explained in greater detail in the blog post Scaling Tips for Large Knowledge Graphs and AI Analysis.
Try the Tutorial
The Musician to Band Connections tutorial walks through this entire pipeline end to end on a real 574-node dataset: SQL-driven data import, a styled Graphviz diagram, the interactive SVG viewer, a published Knowledge Graph, and the results of actually handing that JSON to an AI.
See Also
- From Spreadsheet to Knowledge Graph - the feature announcement.
- I Let an AI Read My Knowledge Graph - a worked example.
- Post-process SVG Files - the companion diagram viewer for sanity-checking a graph's shape before exporting it.
- Full changelog - everything else new in this release.