Adding Style
Styling is where your graphs come alive. Colors, shapes, and layout choices turn raw data into a visual story your audience can understand at a glance. This section introduces the tools that make that possible.
Use the cards below to explore each styling capability in depth.
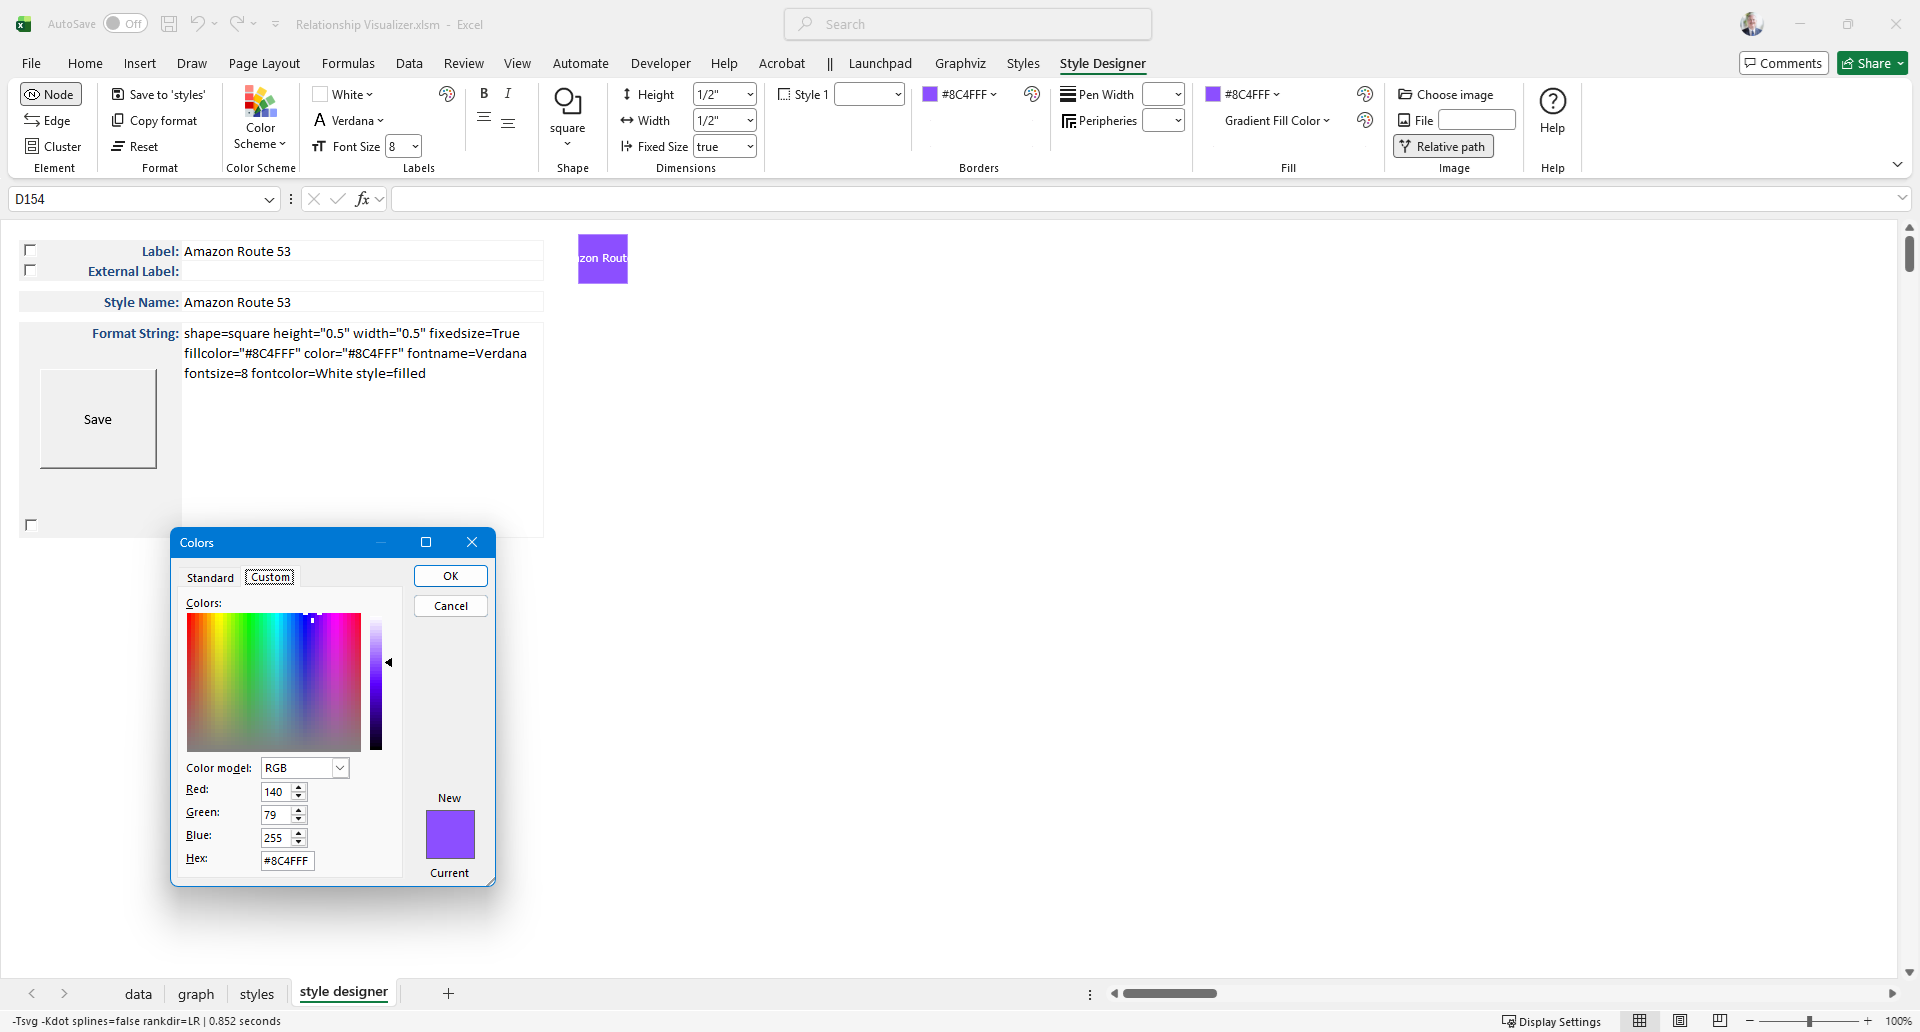 Define reusable styles for nodes, edges, and clusters.
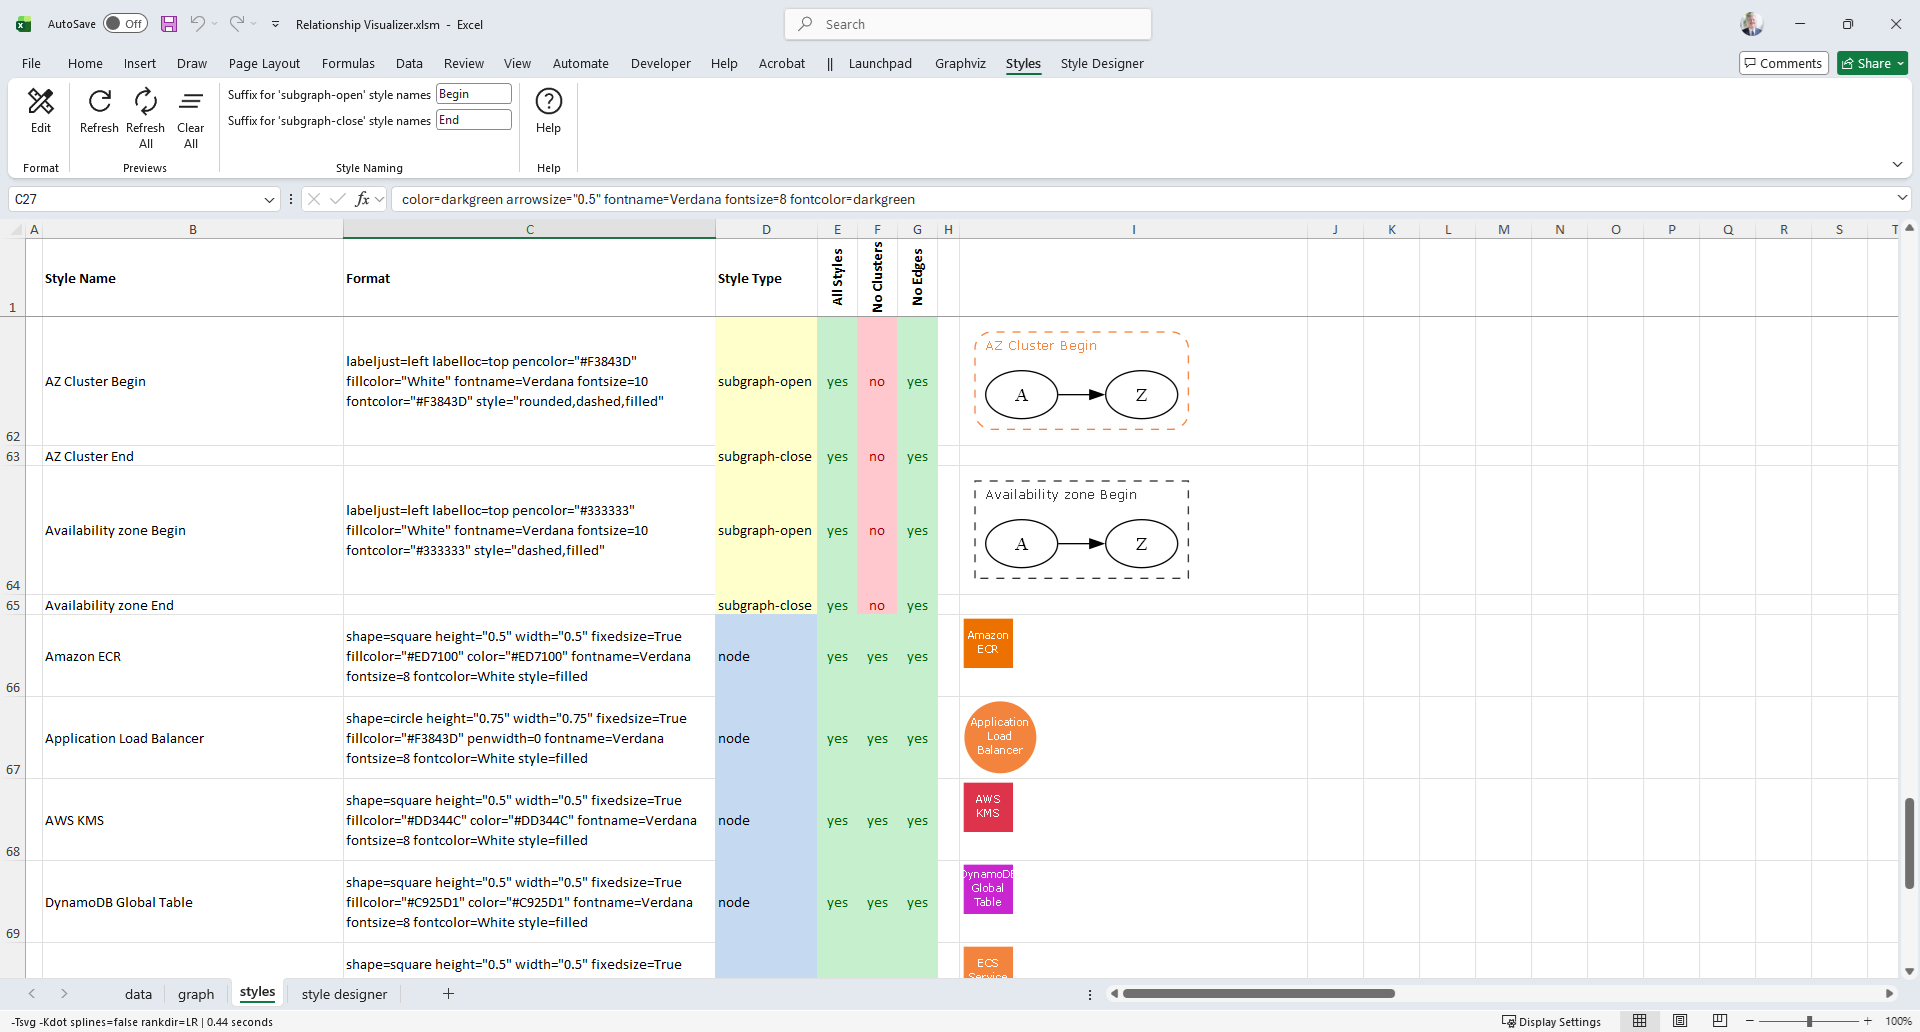 Save and organize your custom styles for reuse.
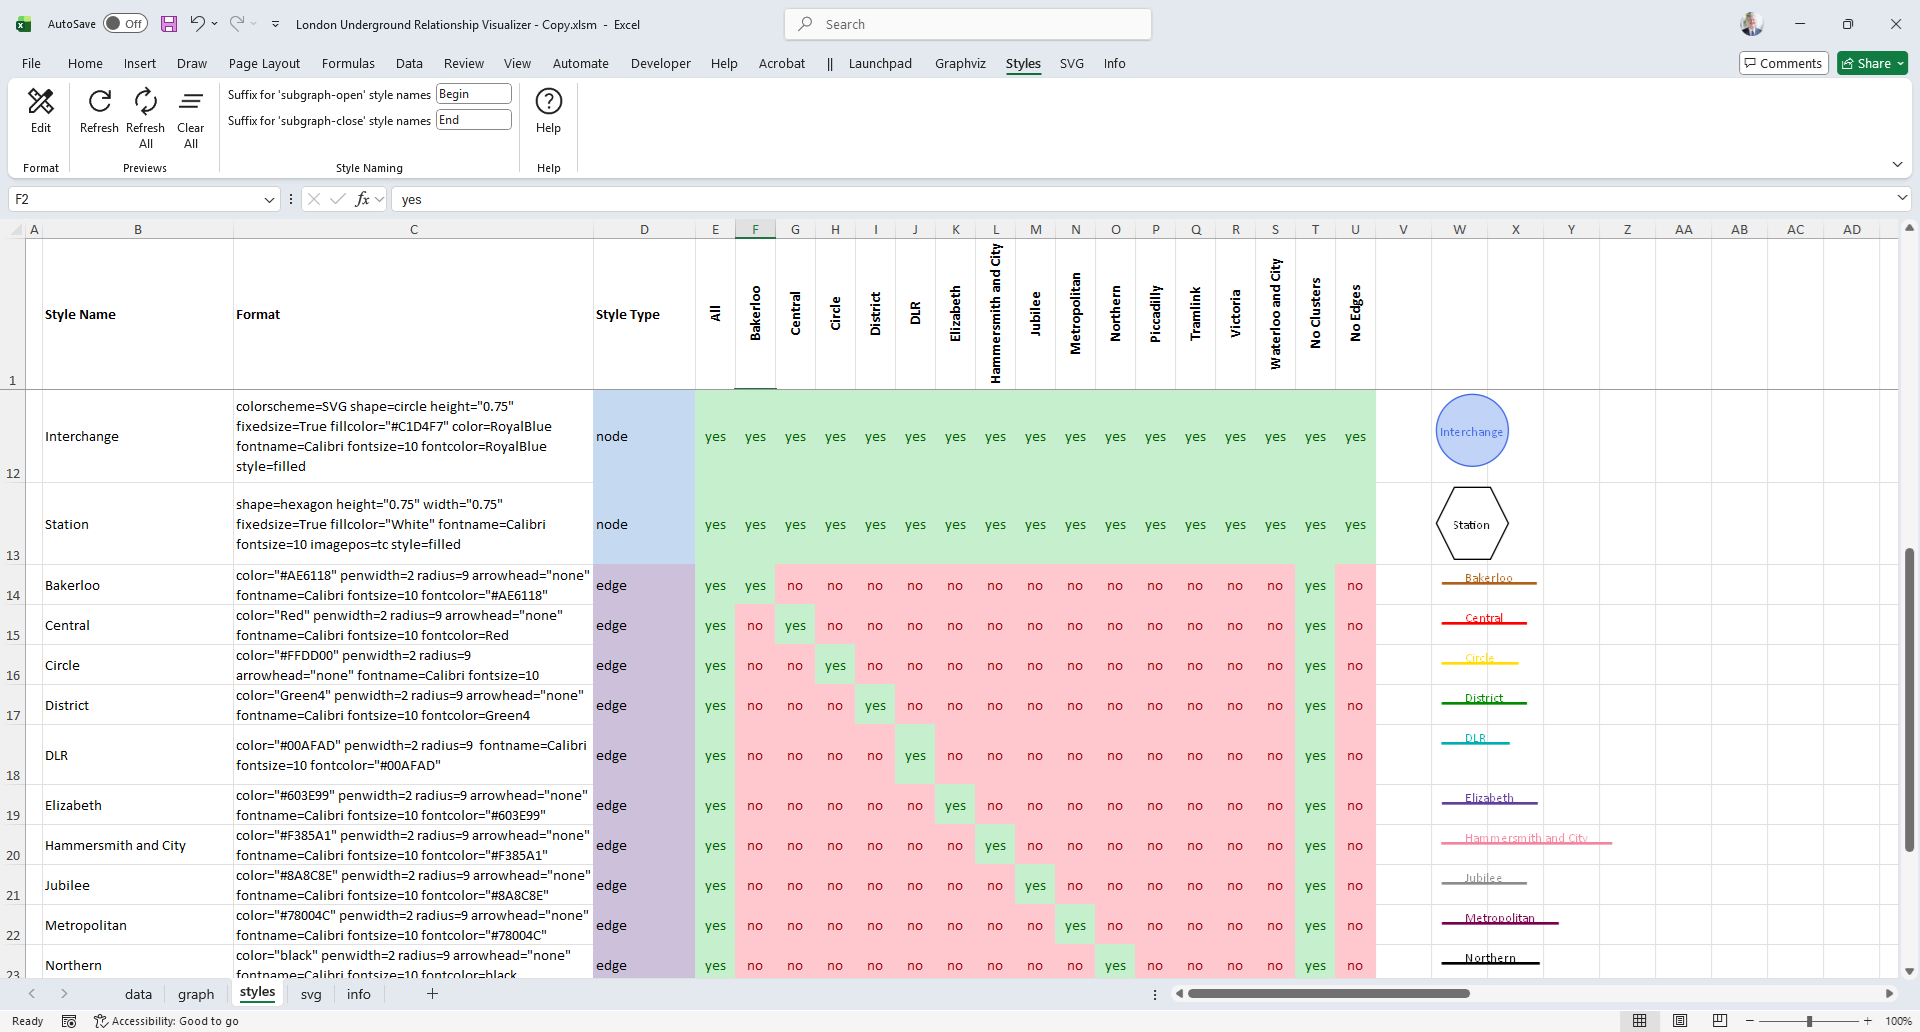 Apply styles selectively to highlight specific data.