Chaining Nodes Using Edges
Chaining nodes is especially useful whenever your data represents an ordered sequence. Even a simple column of values can become a meaningful visual path once edges are created automatically. Common scenarios include:
- Timelines: Turning a list of dates or milestones into a left‑to‑right sequence that shows how events unfold.
- Workflows and Processes: Visualizing approval steps, onboarding stages, or any linear process where one step leads to the next.
- Pipelines: Representing ETL stages, data transformations, or processing phases in the order they occur.
- Queues or Ordered Lists: Showing the exact order in which tasks, tickets, or operations are handled.
- Version Progression: Displaying how versions evolve over time, such as
v1.0 → v1.1 → v1.2 → v2.0. - Routes or Paths: Mapping a sequence of locations, checkpoints, or waypoints into a clear path diagram.
- Dependency Chains: Illustrating simple “A must happen before B” relationships without needing a full dependency tree.
- Learning or Reading Paths: Presenting a recommended sequence of topics, lessons, or readings.
These scenarios all benefit from the automatic edge generation provided by CREATE EDGES, allowing you to transform a basic list into a structured, easy‑to‑read graph with minimal SQL.
Assume you have an Excel workbook with a worksheet named Alphabet that contains a column called letter with four rows of data: A, B, C, and D. Your goal is to chain these values together in sequence.
The following SQL creates nodes A, B, C, D:
SELECT [letter] AS [Item] from [Alphabet$]The CREATE EDGES SQL extension automatically generates edges like A -> B, B -> C, and C -> D.
The SQL is specifed as follows:
SELECT DISTINCT [letter] AS [Item],
TRUE AS [CREATE EDGES]
FROM [Alphabet$]
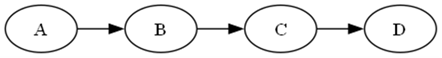
ORDER BY [letter] ASCThe DOT source code appears as:
strict digraph "Relationship Visualizer"
{
    rankdir=LR;
    A -> B;
    B -> C;
    C -> D;
}
Producing this graph: