The data Worksheet
The data worksheet is the core worksheet you will use to create graphs.
Before we create our first graph, lets gain an understanding of the mandatory and optional columns on this worksheet.
The data Worksheet has 11 columns (A-K):
| A | B | C | D | E | F | G | H | I | J | K |
|---|---|---|---|---|---|---|---|---|---|---|
| Indicator | Item | Tail Label | Label | External Label | Head Label | Tooltip | Related Item | Style Name | Attributes | Messages |
Indicator
The Indicator column is used to draw special attention to a row.
- A
#hash character treats the row as a comment. The text in the row will turn green, and no data in this row will be included in the graph. - An
!exclamation mark character will appear if errors are detected in your data on this row. The row will turn red, and an error message will be displayed in the Messages column.
Item
The Item column serves two purposes.
- For nodes, it is a unique identifier of the node.
- For edges, it is the unique identifier of the
fromnode in a (from,to) node pairing. - Mandatory column for nodes and edges.
Tail Label
The Tail Label column contains a text label to be placed near the tail of an edge.
- Only used if an edge relationship has been specified.
- Optional column, hidden by default.
- Inclusion in graph can be toggled on/off.
Label
The Label column contains text to use to label a node, edge, or cluster.
- When specified for nodes, the value is placed inside the shape.
- When specified for edges, the value is placed near the spline.
- Optional column.
- Inclusion in graph can be toggled on/off.
External Label
The External Label column contains text to use to label a node, or an edge.
- When specified for nodes, the value is placed outside the shape, typically above and to the left of the shape.
- When specified for edges, the value is placed away from the spline.
- Optional column, hidden by default.
- Inclusion in graph can be toggled on/off.
If neither a Label or External Label is specified then the graph will default to showing the Item value as the inside label of nodes, and no data for edges.
Head Label
The Head Label column contains a text label to be placed near the head of an edge.
- Only used if an edge relationship has been specified.
- Optional column, hidden by default.
- Inclusion in graph can be toggled on/off.
Tooltip
The Tooltip column specifies text to be displayed as a tooltip for clusters, nodes, or edges.
- Only applies to graphs saved as files in the
SVGformat. - Optional column, hidden by default.
Related Item
The Related Item column is the unique identifier of the to node in a (from, to) node pairing.
- Mandatory column when specifying a relationship (edge).
Style Name
The Style Name column indicates which style definition in the styles worksheet to use when drawing the graph.
- Optional column.
- Inclusion in graph can be toggled on/off.
Attributes
The Attributes column provides a means to add extra elements of style which will only apply to a single row. For example, you can place style attributes in this column to change the color of a key relationship, or the fill color of a key shape you wish to highlight.
- Optional column.
- Inclusion in graph can be toggled on/off.
Messages
When the graphing macros run, they check for common data mistakes, such as specifying only one node for an edge.
If mistakes are found, they are reported in this column. Additionally, an exclamation mark (!) is placed in the Indicator column, and the row is highlighted in red to draw your attention to the error.
- Column is hidden by default.
- Column is shown if an error is detected.
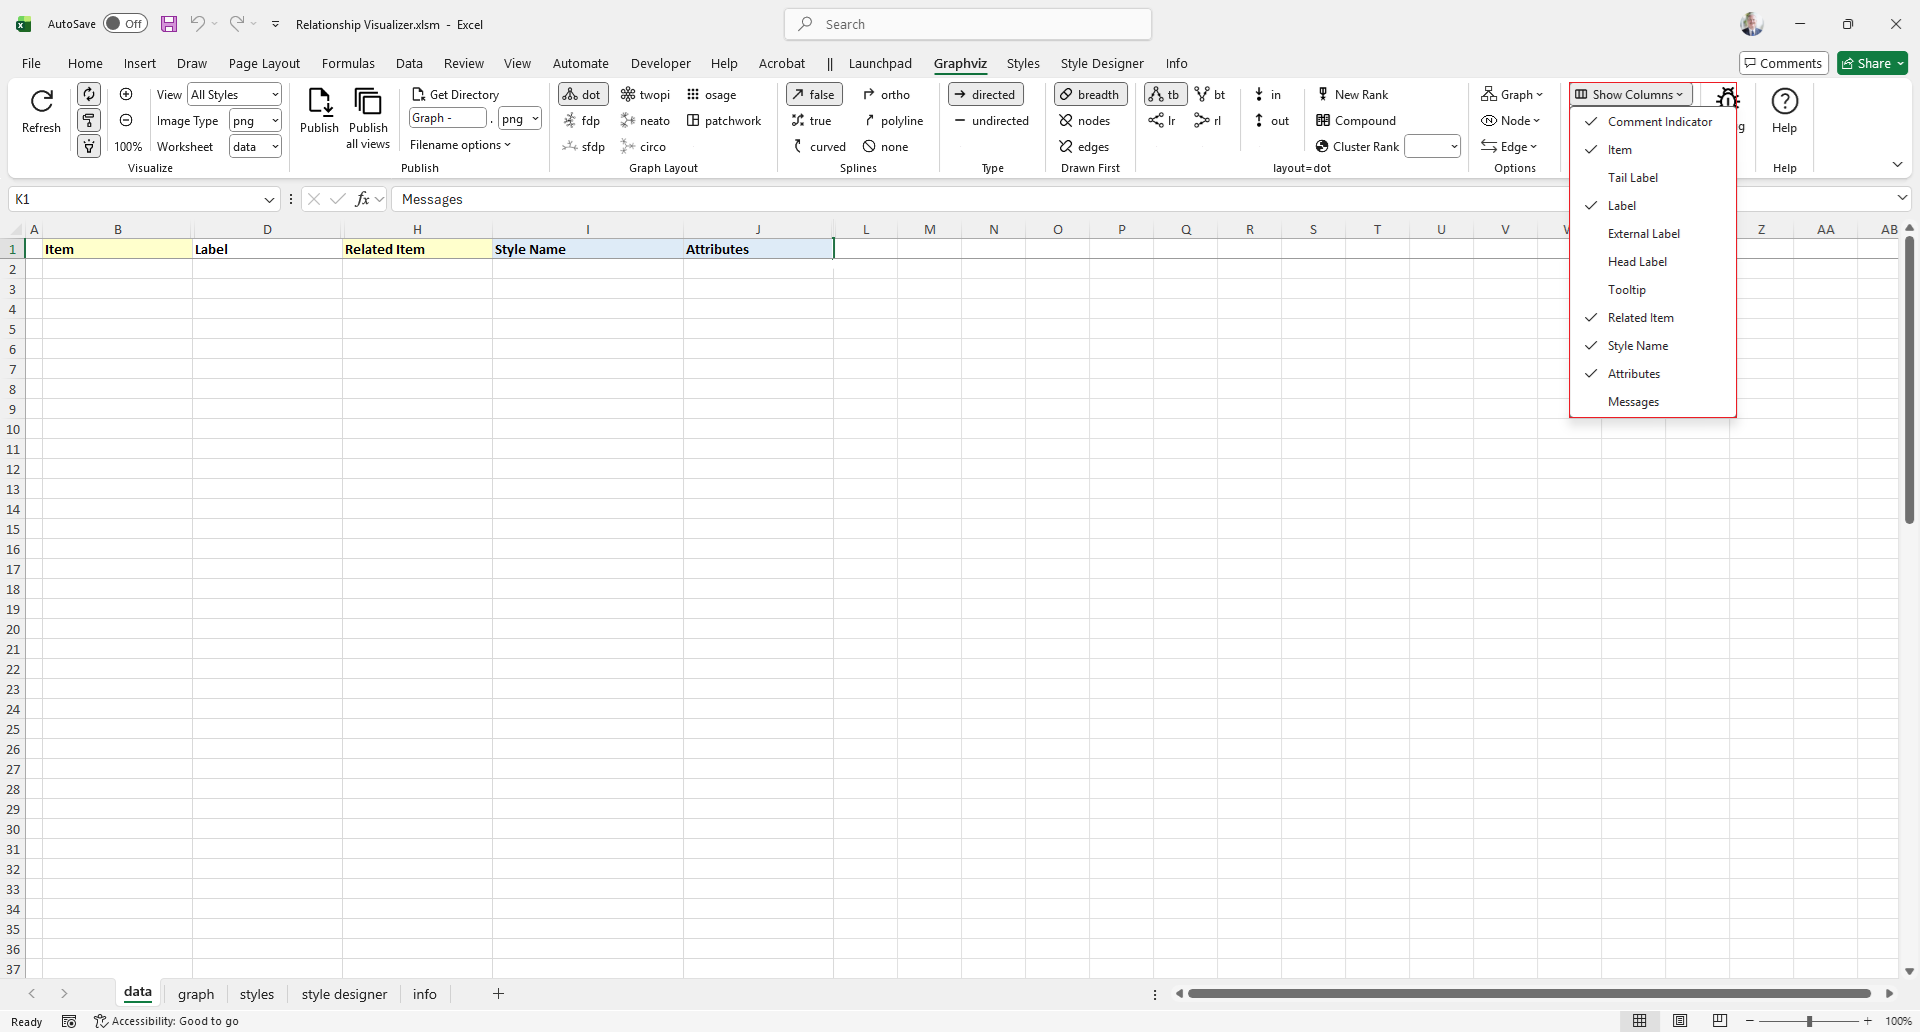
Show Hidden Columns
The columns for Tail Label (C), External Label (E), Head Label (F), Tooltip (G), and Messages (K) are hidden by default, since they are less frequently used.
You can quickly toggle the visibility of these columns by selecting the column name from the list in the dropdown menu beneath the Show Columns button in the 'data' Worksheet group' on the right side of the Ribbon.