Add Style to Your Graphs
Styling is what transforms a raw graph into a clear, expressive visualization, helping your graph tell a more compelling story. This section introduces the tools and techniques for applying styles to nodes, edges, and clusters.
Use the links below to explore each styling capability in depth.
| Style Designer | Style Gallery | Create Views |
|---|---|---|
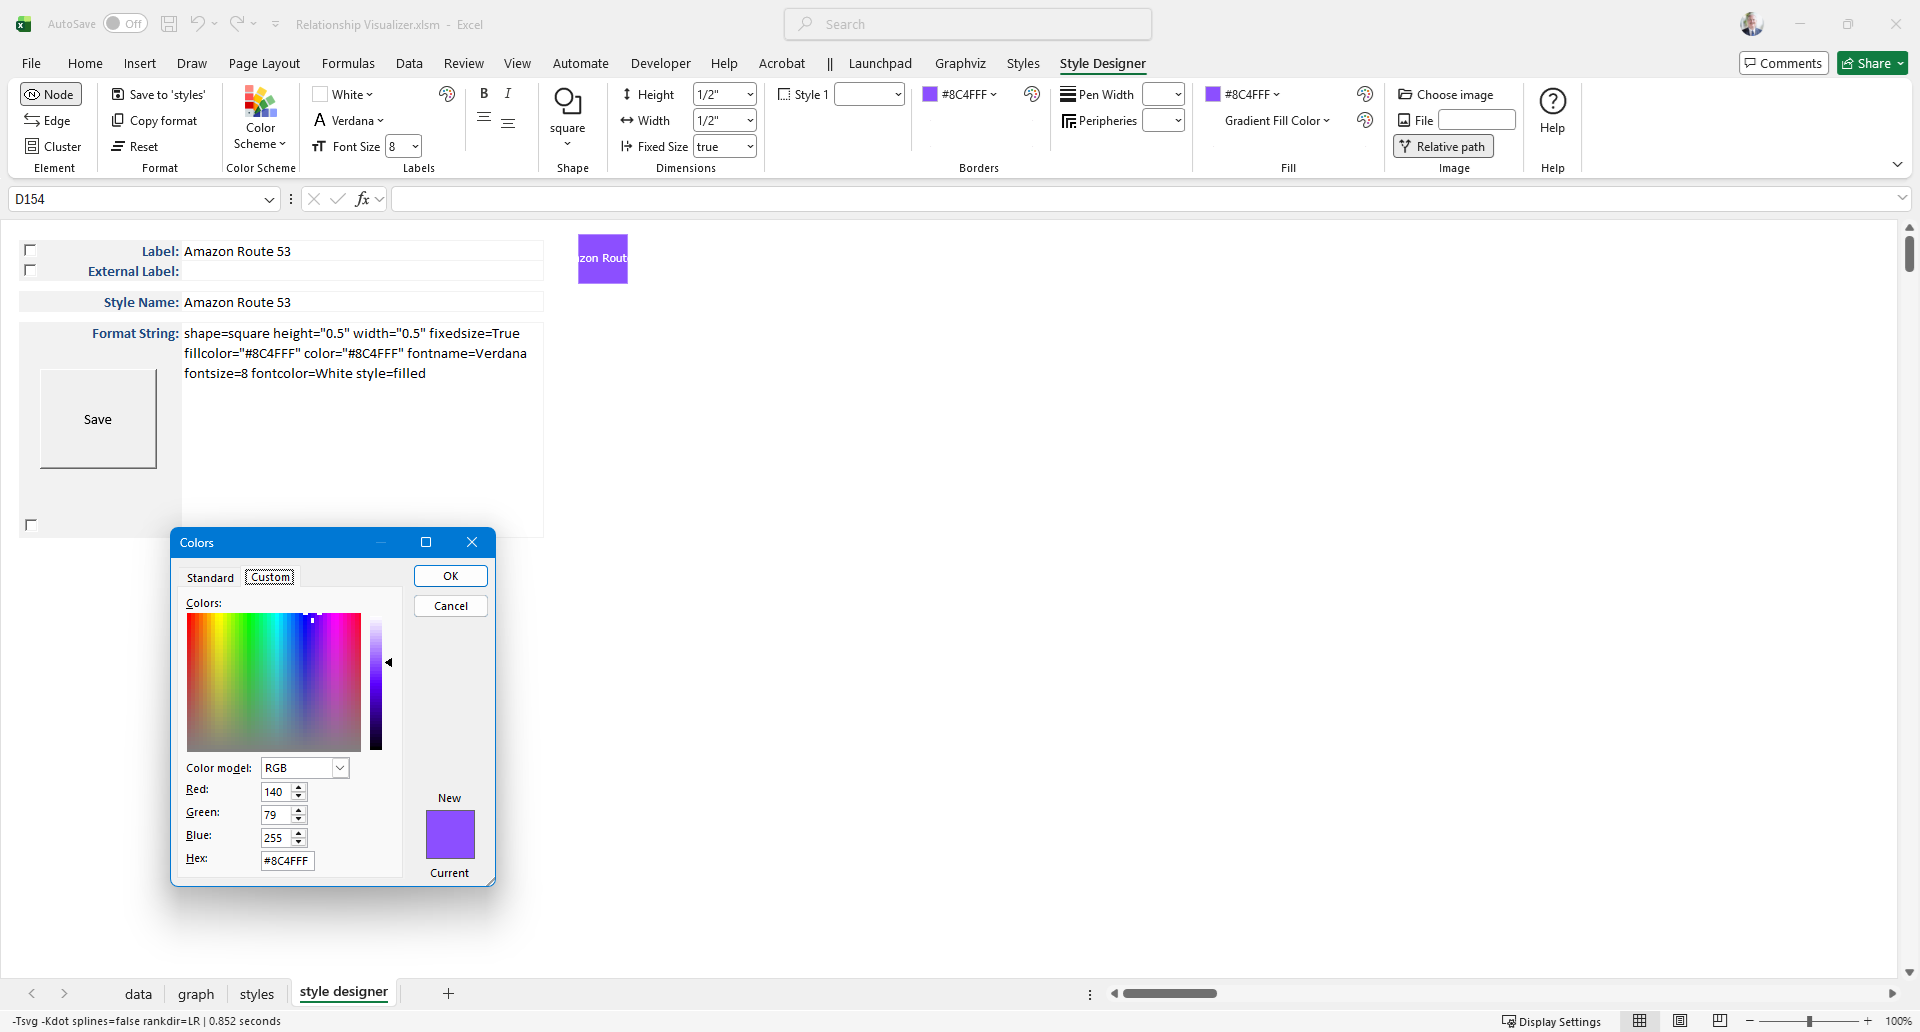 | 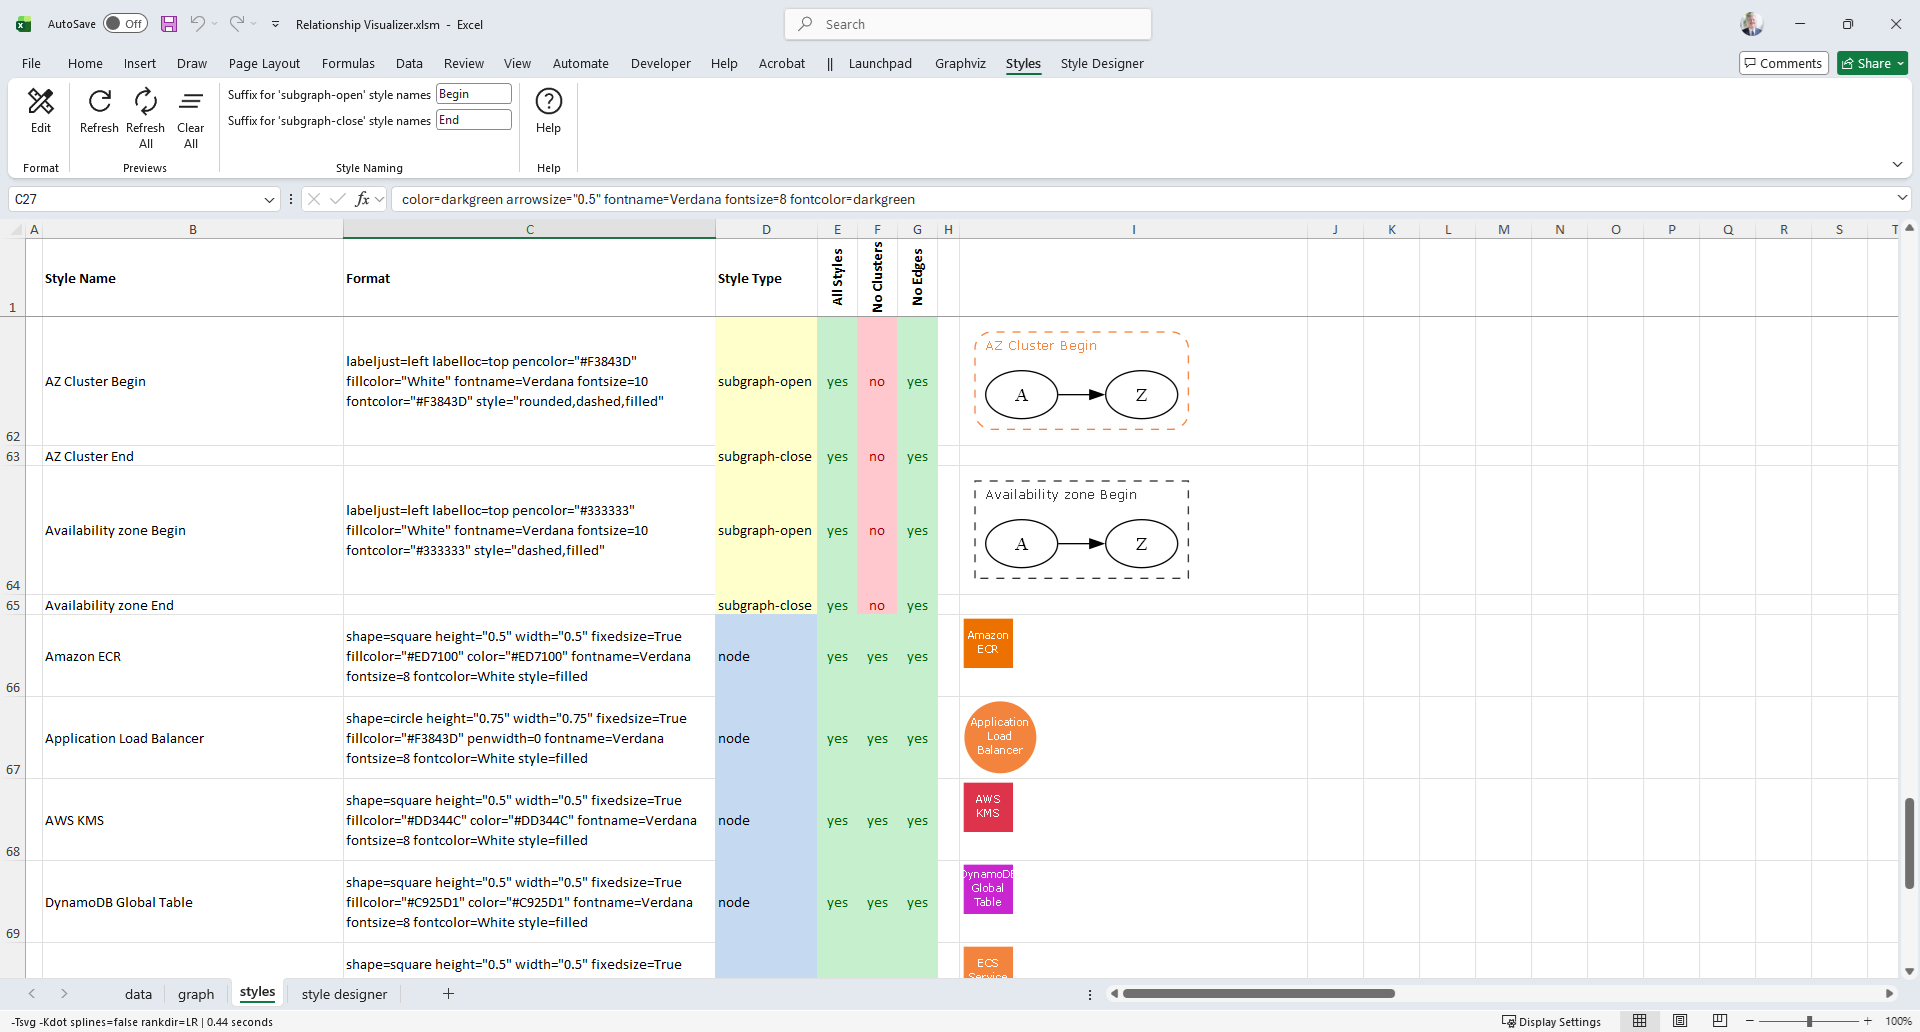 | 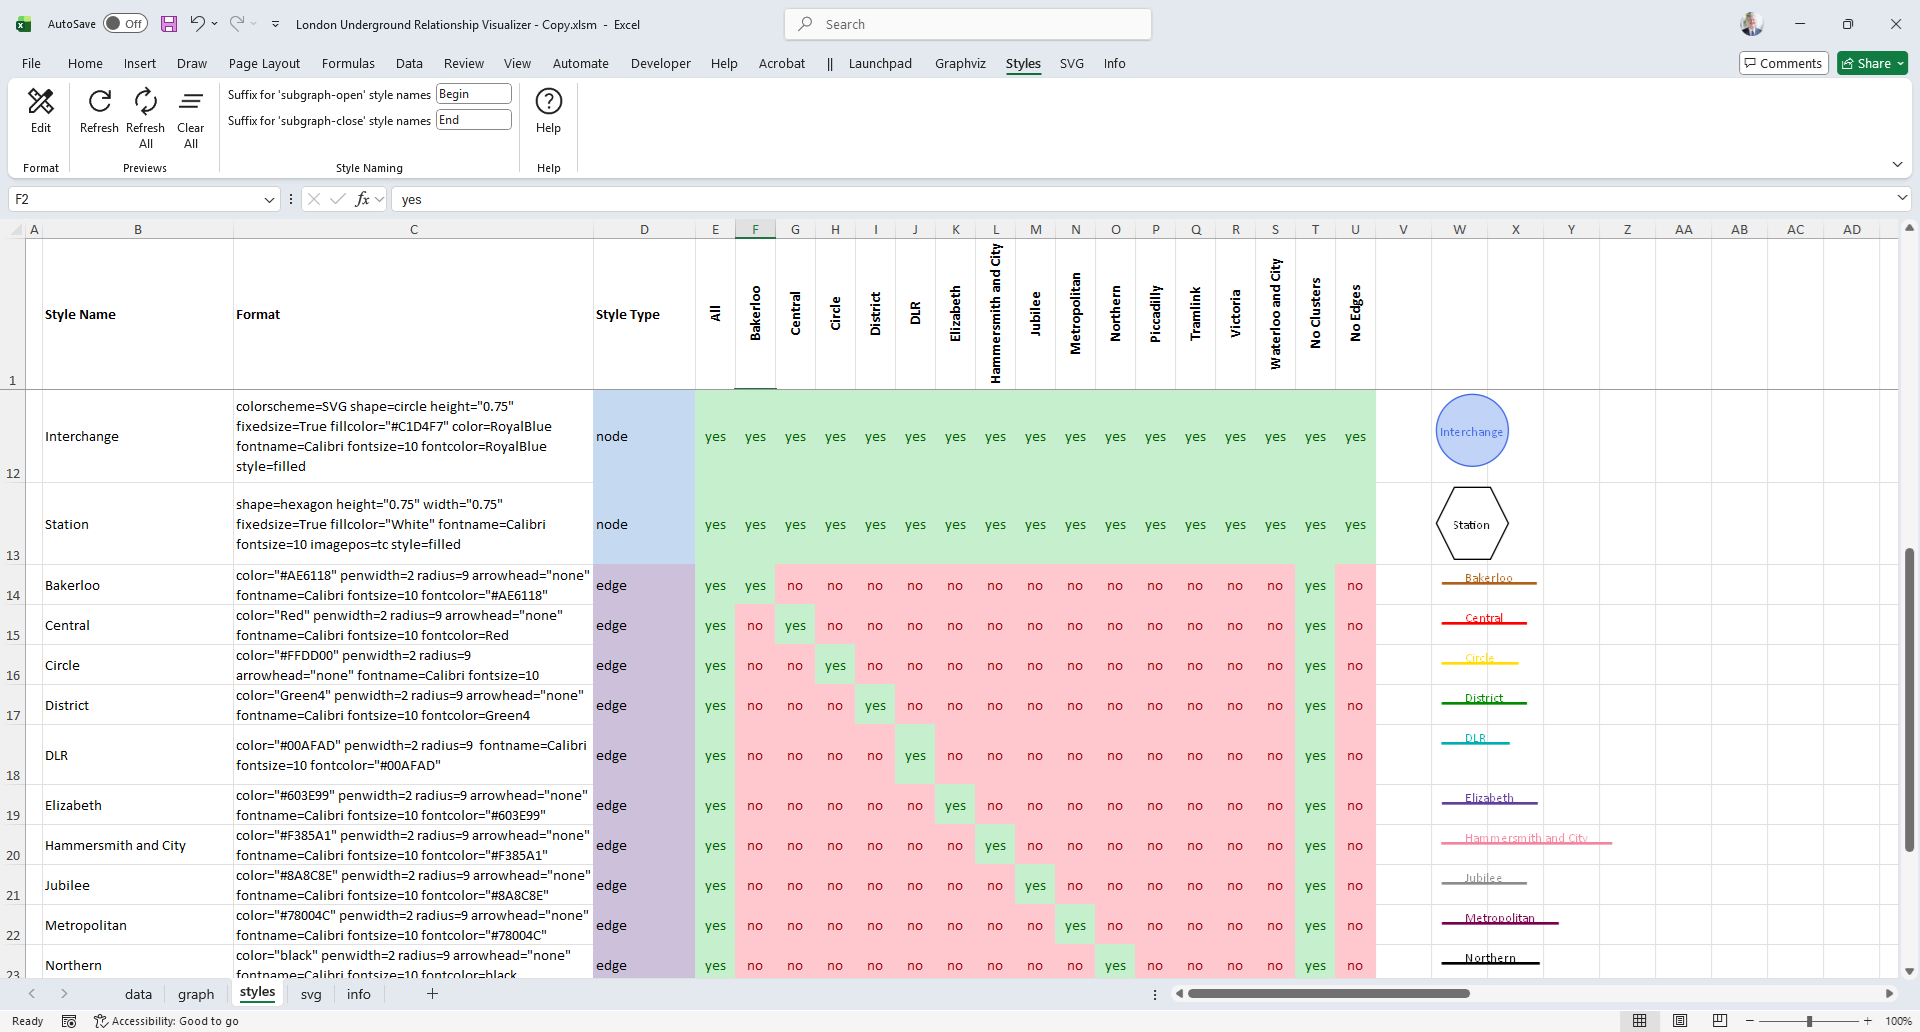 |
| Define reusable styles for graph elements. Control color, shape, font, and layout attributes with precision. | Save and organize your custom styles in a gallery for easy reuse across graphs and workbooks. | Apply styles selectively to create focused views highlighting specific data or relationships. |