Visualize Graphs Using Excel
Create Graphviz graphs directly from your Excel data
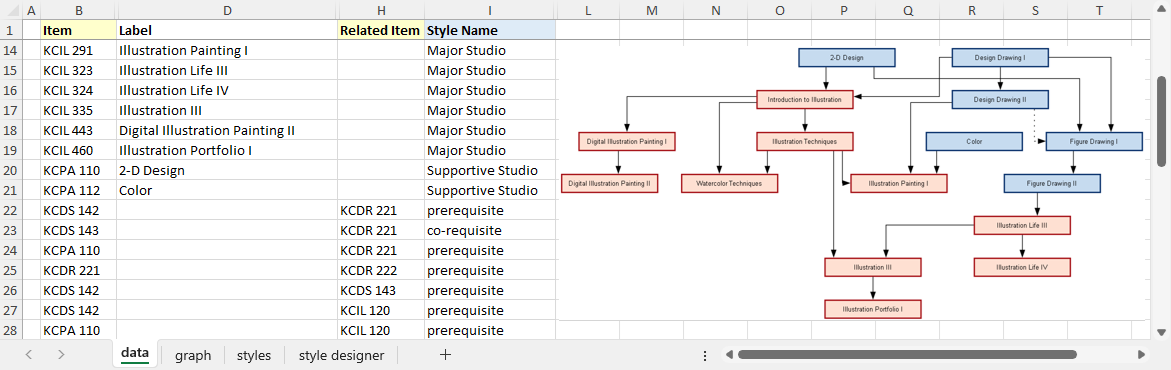
The Relationship Visualizer spreadsheet transforms your Excel tables into clear, professional Graphviz diagrams in seconds. Say goodbye to manual drawing tools — simply enter your data as rows (e.g., "A is related to B"), and watch graphs appear automatically.
Whether you're mapping data flows, org charts, timelines, ERDs, or circuits, this tool makes complex relationships instantly understandable.
| Draws as you type | Live Graphviz rendering as data changes |
| Powerful styling | Colors, shapes, fonts, arrows, reusable styles |
| Advanced features | SQL queries, SVG animation, DOT preview, JSON exchange |
| Cross-platform | Works on Windows and macOS |
| Sleek UI | Custom Excel ribbon tabs across all worksheets |
| Multilingual | English · French · German · Italian · Polish |
| Absolutely Free | Free to use · No license required · Donations appreciated |
| Open Source | MIT License |
| Rich Code Documentaion | AI-powered DeepWiki |
| Show Your Support | Buy Me a Coffee! |
| Award Winning | SourceForge Community Choice Award |
