Creating Organization Charts
A frequent question is: “Can you create organization charts using the Relationship Visualizer?”
The answer is YES!
The tool's support for recursive SQL queries and parent–child relationships makes it well‑suited for generating multi‑level organizational hierarchies. As long as your dataset includes clear parent and child identifiers, the Relationship Visualizer can automatically construct a complete org chart—whether it's a simple two‑level structure or a deeply nested hierarchy.
What is Recursion?
Recursion works by having a function repeatedly call itself, each time handling a smaller piece of the problem. The process continues until it reaches a base case that tells it when to stop.
Recursive SQL Queries
Relationship Visualizer Version 7.2 introduced support for recursive SQL queries, enabling the automatic construction of hierarchical structures such as organization charts, dependency trees, and connected data paths. Recursive queries allow the tool to walk parent–child relationships repeatedly, building multi‑level hierarchies from simple row‑based data.
To use this feature effectively, the candidate dataset must include the key columns that define each relationship:
- A parent node
- A child node
These columns form the backbone of the hierarchy, allowing the recursive query engine to traverse upward or downward through the structure and generate a complete, layered graph.
A recursive query consists of two essential parts:
Anchor the Base Case
This defines the starting point for recursion—typically the top‑level parent in the hierarchy (for example, the CEO in an organization chart or the root node in a dependency tree). The anchor member returns the initial set of rows from which the hierarchy will begin.Define the Recursive Member
This portion of the query describes how to repeatedly join the growing result set back to the source table. Each iteration locates the next level of child nodes, allowing the hierarchy to expand downward (or upward) until no additional relationships remain.
SQL Extensions
Four new keywords unique to Relationship Visualizer have been defined to enable recursive queries:
TREE QUERY- Passed as a literal string, the presence ofTREE QUERYin the SQL result set tells the SQL engine to execute the associated SQL recursively.The SQL must contain the symbolic value
''{WHERE VALUE}''which will be replaced as each node is traversed with the value of the current node.Note that since
TREE QUERYis passed as a literal string, any strings in the SQL which would normally be specified with'delimiters must be escaped as''.WHERE VALUEprovides the value which anchors the base case. For example, in an organization chart it could be the ID of the CEO. For a subway line, it could be the starting subway station.WHERE COLUMN- Specifies the name of the column which defines the recursive member. It is the name of the column containing the value which should be searched next. For example, in an organization chart it could be column name of the column containing the ID of the employee's manager.MAX DEPTH- Specifies an optional integer value which specifies the maximum number of branches preceding, or following the node specified byWHERE VALUE. For example,3 AS [MAX DEPTH]says to constrain the search to 3 edge ranks which follow a node , or 3 edge ranks which precede a node , depending upon the direction of the search.
Scenario
You need to understand how the Executive Branch of the United States government is organized, so you want to create an organization chart.
No political messages are intended
A sample dataset of historical data is used purely for demonstration. This data was collected using AI and reflects the Executive Branch in place at the time the data was collected.
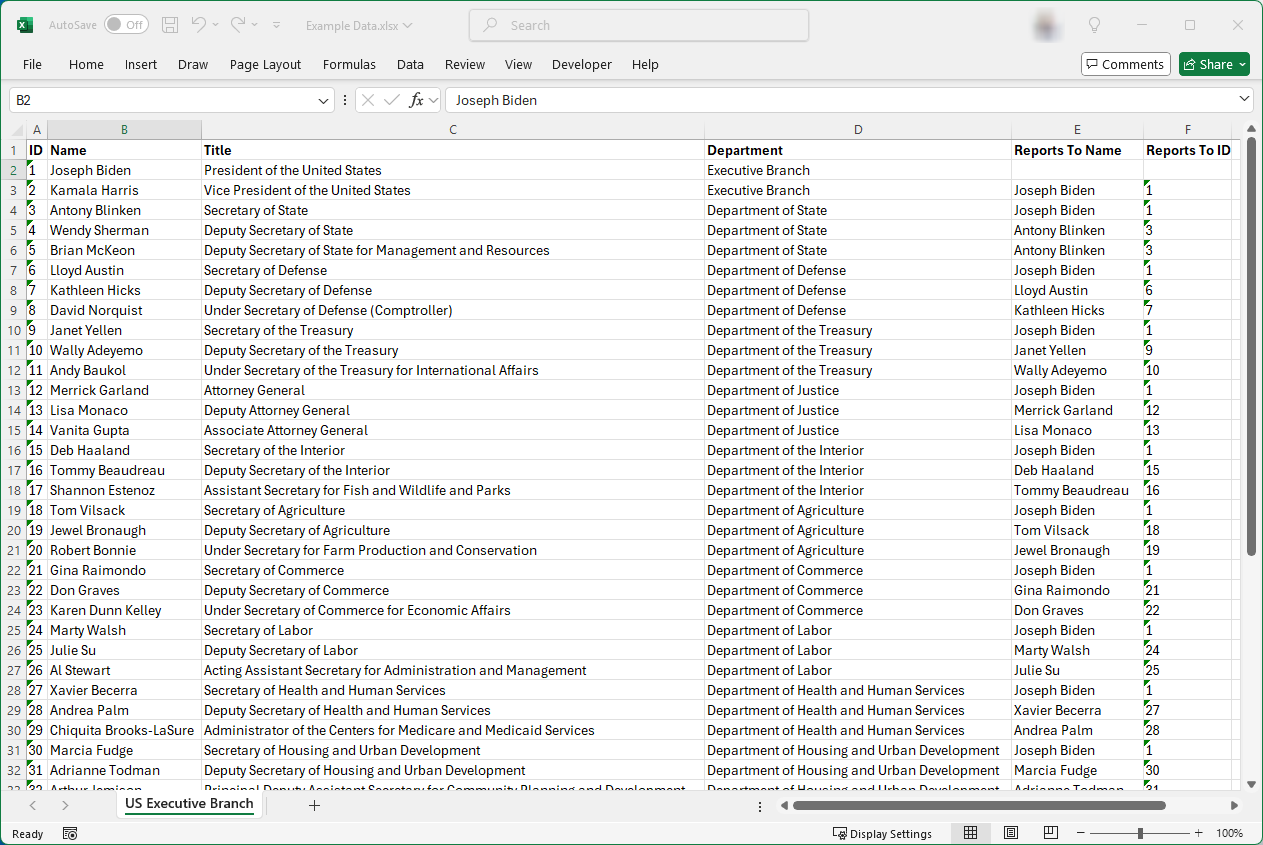
Assume you have an Excel workbook with a worksheet named US Executive Branch containing columns such as Name, Title, Department, and Reports To. The data appears as follows:
 |
|---|
Standard Query
The traditional way to graph this data was to use a query such as:
SELECT [Reports To ID] AS [ITEM],    [ID]        AS [RELATED ITEM],
       [Department]    AS [CLUSTER], 'Border 2 ' AS [CLUSTER STYLE NAME]
FROM   [US Executive Branch$]
which relates the Reports To ID to the ID, and clusters the nodes by Department, using the Border 2 style on the styles worksheet.
Running the SQL produces the following (undirected) graph:
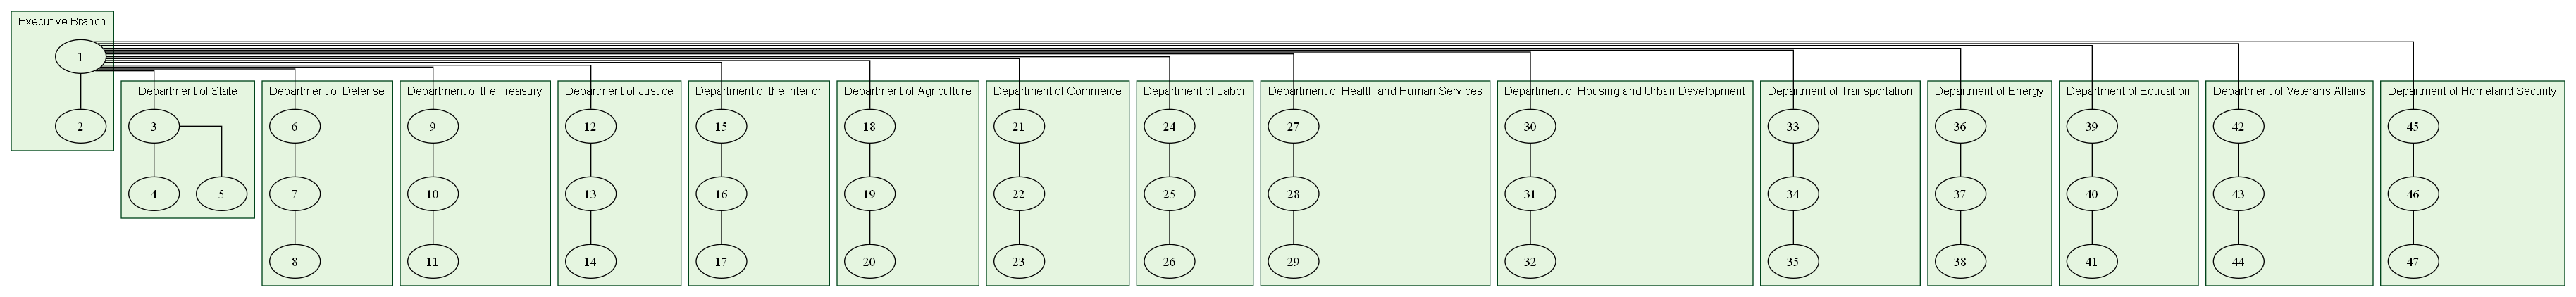
The issue with this approach is that it graphs the entire organization. For instance, if you only want to graph the department heads, there isn't a specific column in the data to filter by.
Tree Query
Max Depth
A tree query which specifies a Max Depth will allow us to extract just the department heads from the full organization.
We write the Tree Query as follows:
SELECT
  'SELECT [ID], [Reports To ID] AS [ITEM],    [ID] AS [RELATED ITEM],
                [Department]    AS [CLUSTER], ''Border 2 '' AS [CLUSTER STYLE NAME]
          FROM [US Executive Branch$] WHERE [Reports To ID] = ''{WHERE VALUE}'''
       AS [TREE QUERY],
  '1'  AS [WHERE VALUE],
  'ID' AS [WHERE COLUMN],
  1    AS [MAX DEPTH]
Where Value
In this query we are using ID = 1 (President of the United States), and a Max Depth = 1. The graph changes to:

If we change the Max Depth to 2, the graph changes to:

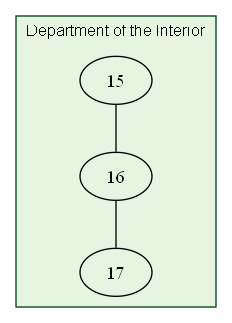
Likewise we can choose the ID of department head and obtain the organzation chart for a single department. 15 is the ID for the head of the Department of the Interior. If we change the WHERE VALUE in query to 15, and MAX DEPTH to 2, the query becomes:
SELECT
  'SELECT [ID], [Reports To ID] AS [ITEM],    [ID] AS [RELATED ITEM],
                [Department]    AS [CLUSTER], ''Border 2 '' AS [CLUSTER STYLE NAME]
          FROM [US Executive Branch$] WHERE [Reports To ID] = ''{WHERE VALUE}'''
       AS [TREE QUERY],
  '15' AS [WHERE VALUE],
  'ID' AS [WHERE COLUMN],
  2    AS [MAX DEPTH]
and the graph changes to:
Styling the Nodes
Named Styles
The tree structure has been determined, now we want to create styled nodes with department detail.
The first step is to create a style definition on the styles worksheet. We use the style designer tab to create a style named Department which appears as follows:

Label Text Format
We would also like the name of the department head to appear in bold text, and the job title to appear as normal text on its own line, separated by a blank line. Graphviz supports HTML-like labels which can be used. The HTML-like label needs to follow the pattern
<<b>Name</b><BR/><BR/>Title>
for example:
<<b>Deb Haaland</b><BR/><BR/>Secretary of the Interior>
Label Line Splits
We are also concerned about the length of the names or titles being larger than the width of the rectangle we have defined. The Relationship Visualizer SQL interpreter has features which allow you to split text at the nearest blank character after a specified length, and a feature to allow you to specify a string at the point the the split.
In the SQL we can specify
'25' AS [SPLIT LENGTH]to split each line in the label as close as possible to the 25th position'<BR/>' [AS LINE ENDING]as the line ending of each break in the string. The label is HTML-like, so we use an HTML break representation<BR/>.FYI, if we were using plain-text labels the line ending choices would be
\lfor left justied breaks,\nfor centered breaks, or\rfor right-justified breaks. If we were using a Graphvizrecordshape the line ending could be|. You have complete flexibility to insert any text at the point of a split in the text.
The label will be emitted to fit within the rectangle, as follows:
<<b>Deb Haaland</b><BR/><BR/>Secretary of the<BR/>Interior>
Writing the Node Query
Our first query traverses the tree and writes the Item is related to Related Item edge relationships. We now repeat the query to traverse the tree a second time, but we will only output information specific to the nodes.
The Node query is specified as:
SELECT
      'SELECT [ID] AS [ID],
              [ID] AS [ITEM],
              ''<<b>'' & [Name] & ''</b><br/><br/>'' & [Title] & ''>'' AS [LABEL],
              ''25''         AS [SPLIT LENGTH],
              ''<BR/>''      AS [LINE ENDING],
              ''Department'' AS [STYLE NAME]
       FROM   [US Executive Branch$]
       WHERE  [Reports To ID] = ''{WHERE VALUE}'''
                    AS [TREE QUERY],
      '15'  AS [WHERE VALUE],
      'ID' AS [WHERE COLUMN],
      2 AS [MAX DEPTH],

      [ID] AS [ITEM],
      '<<b>' & [Name] & '</b><br/><br/>' & [Title] & '>' AS [LABEL],
      '25'         AS [SPLIT LENGTH],
      '<BR/>'      AS [LINE ENDING],
      'Department' AS [STYLE NAME]
FROM  [US Executive Branch$]
WHERE [ID] = '15'
where the label is specified as
''<<b>'' & [Name] & ''</b><br/><br/>'' & [Title] & ''>'' AS [LABEL],to concatenate column values with literal strings to create the HTML-like label described above.
The line splitting is specified as:
              ''25''         AS [SPLIT LENGTH],
              ''<BR/>''      AS [LINE ENDING],
The Node style is specified as:
''Department'' AS [STYLE NAME]One additional thing you must notice is that this syntax repeats as:
      [ID] AS [ITEM],
      '<<b>' & [Name] & '</b><br/><br/>' & [Title] & '>' AS [LABEL],
      '25'         AS [SPLIT LENGTH],
      '<BR/>'      AS [LINE ENDING],
      'Department' AS [STYLE NAME]
The reason for this repeated syntax is related to the dual-query nature of a recursive tree query. At the beginning of this document, the concept of Anchoring the Base Case is discussed. This syntax outputs the node information for the base case (in this example, ID = 25). To create a complete organization chart, we must output the node information for the base case and for each branch of the tree as it is traversed.
Important: Pay very close attention to how literal strings are represented in the Base Case query, and the Recursive Member Case query to avoid SQL syntax errors.
The Base Case query uses 1 single quote to denote a string.
sql'<<b>' & [Name] & '</b><br/><br/>' & [Title] & '>' AS [LABEL], '25' AS [SPLIT LENGTH],The Recursive Member query uses 2 single quotes to denote a string within the
TREE QUERYstring (i.e. strings within a string require 2 single quotes).sql''<<b>'' & [Name] & ''</b><br/><br/>'' & [Title] & ''>'' AS [LABEL], ''25'' AS [SPLIT LENGTH],
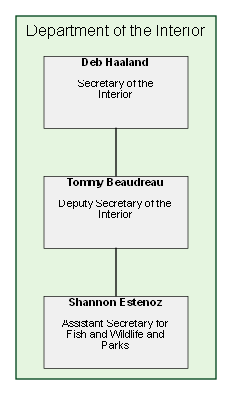
When we run the query, the nodes are output as:

Combining the Edges and Nodes
Now it just a matter of running both SQL statements to combine the edges and nodes.
SELECT
'SELECT [ID], [Reports To ID] AS [ITEM], [ID] AS [RELATED ITEM],
[Department] AS [CLUSTER], ''Border 2 '' AS [CLUSTER STYLE NAME]
FROM [US Executive Branch$] WHERE [Reports To ID] = ''{WHERE VALUE}'''
AS [TREE QUERY],
'15' AS [WHERE VALUE],
'ID' AS [WHERE COLUMN],
2 AS [MAX DEPTH]
SELECT
'SELECT [ID] AS [ID],
[ID] AS [ITEM],
''<<b>'' & [Name] & ''</b><br/><br/>'' & [Title] & ''>'' AS [LABEL],
''25'' AS [SPLIT LENGTH],
''<BR/>'' AS [LINE ENDING],
''Department'' AS [STYLE NAME]
FROM [US Executive Branch$]
WHERE [Reports To ID] = ''{WHERE VALUE}'''
AS [TREE QUERY],
'15' AS [WHERE VALUE],
'ID' AS [WHERE COLUMN],
2 AS [MAX DEPTH],
[ID] AS [ITEM],
'<<b>' & [Name] & '</b><br/><br/>' & [Title] & '>' AS [LABEL],
'25'         AS [SPLIT LENGTH],
'<BR/>' AS [LINE ENDING],
'Department' AS [STYLE NAME]
FROM [US Executive Branch$]
WHERE [ID] = '15'The organization chart for the Department of the Interior ID=15 appears as:
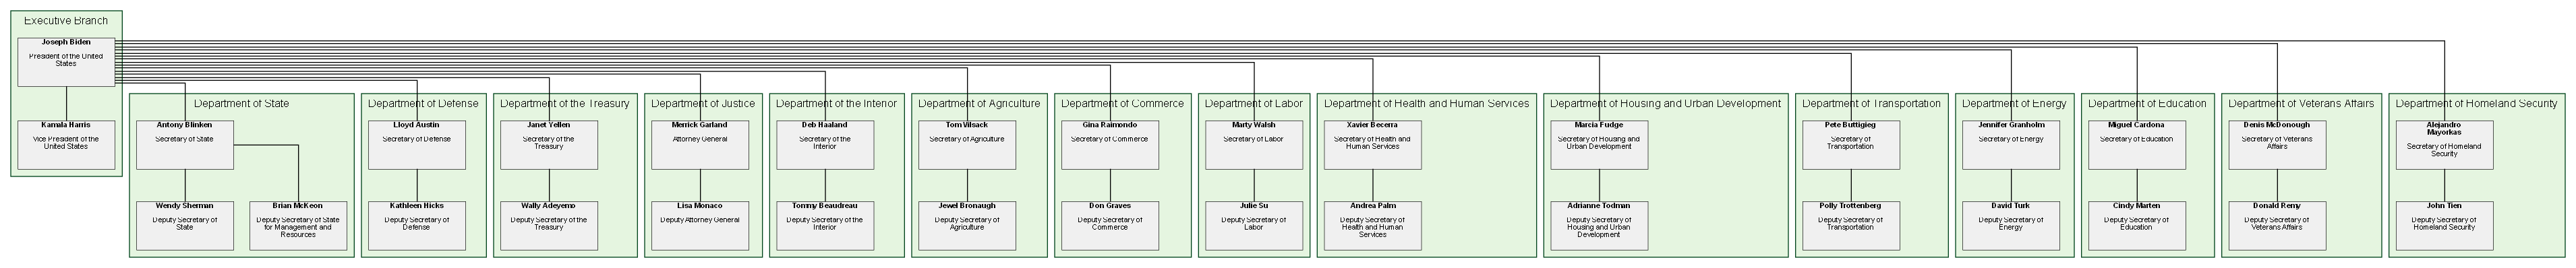
Running the queries starting with the President of the United States (ID=1) and Max Depth = 1 shows the Presidents cabinet.

with Max Depth = 2 we see the Secretaries and Deputy Secretaries
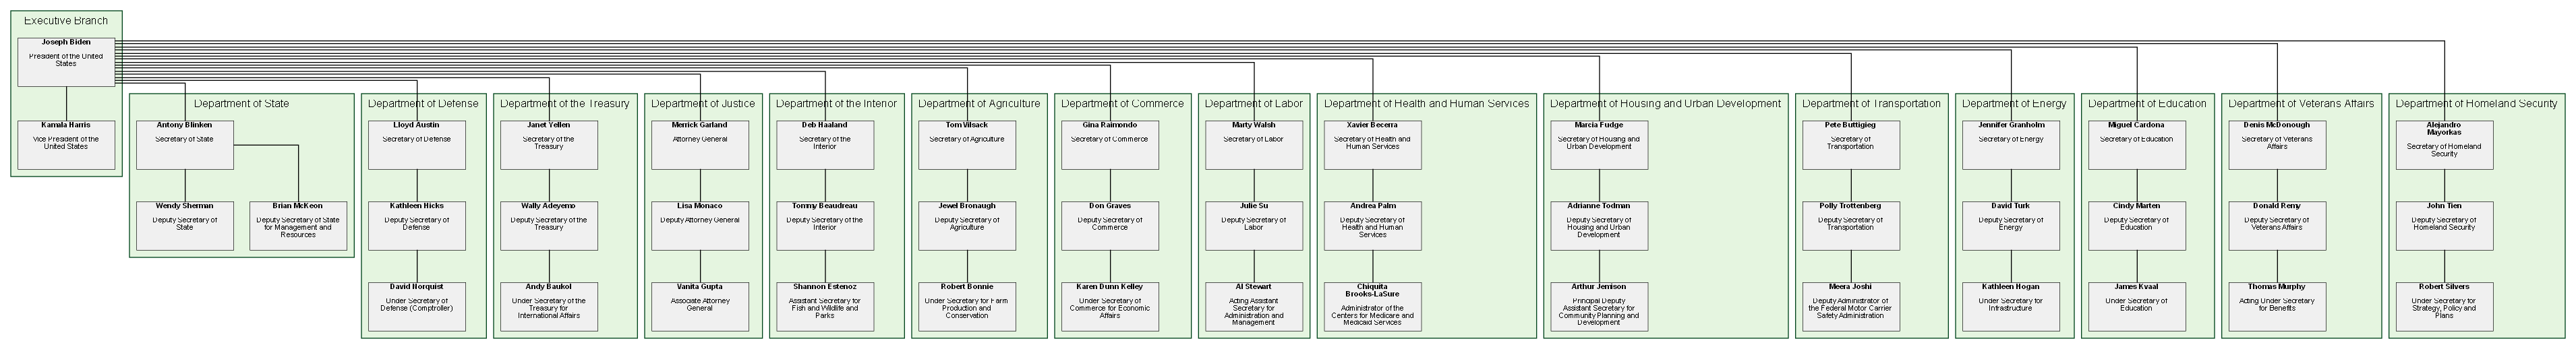
Specifying Max Depth = 0 removes the depth limit, and we get the full organization chart.
Sample Content
The files used in these examples are contained in the \Relationship Visualizer\samples\13 - Using SQL - Organization Charts directory in the zip file download.