Changing Master Settings
The settings worksheet is where you can customize overarching settings which control how the graph is created, specify directories containing images to use in the graph, control how long the graphing engine is allowed to run, specify Graphviz command line parameters, and modify the order in which the worksheet columns are laid out.
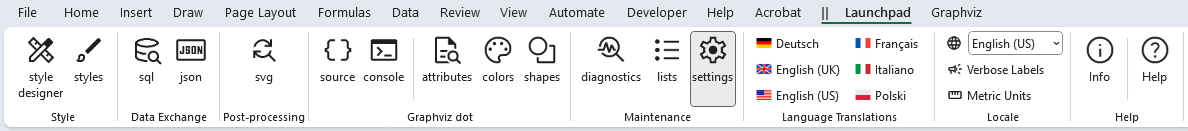
The settings worksheet is displayed by selecting the Settings button on the Launchpad ribbon tab. This sheet provides access to the configuration values that control how the Relationship Visualizer operates.
The following sections provide a brief description of the settings:
Graph Options
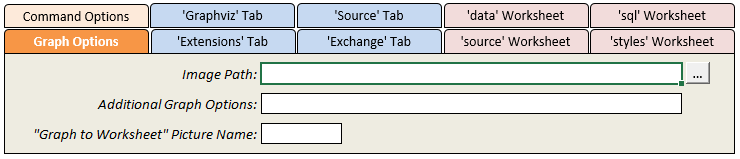
These settings control the graph options used to produce the diagrams.
| Setting | Description |
|---|---|
| Image Path | Specifies one or more directories when images to include in the graph are stored. The Relationship Visualizer looks for images in the same directory where the spreadsheet is stored first, followed by the directory specified here. The folder picker allows you to select one directory, however multiple directories can be specified if the directories are separated by a semi-colon ;.If you use the style designer worksheet to design an image node the directory containing the image will be automatically appended to the value here, unless the directory is already listed or is the directory where the Excel spreadsheet is stored. |
| Additional Graph Options | A means to insert additional Graphviz graph directives into the graph at the top-most level. To use this setting, you must understand how Graphviz works. This setting can be used to control aspects such as node spacing. For example: sep="+30,300" |
| “Graph to Worksheet” Picture Name | The name to assign to the picture object containing the bitmap which is created by the Refresh Graph button on the Data worksheet. If this value is blank, Excel assigns a name. |
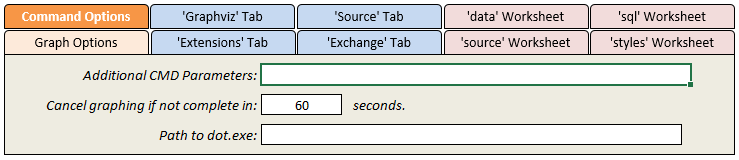
Command Options
The Command Options settings allow you to pass parameters to the Graphviz command line programs.
| Setting | Description |
|---|---|
| Additional CMD Parameters | A means to pass additional command line parameters to the layout engine program. For example: -Efontsize="8" -Efontname="Arial" would override the default edge format. Setting the font size to 8 points, and the font to Arial for all edges which do not have explicit style specifications. |
| Cancel graphing if not complete in __ seconds | The maximum number of seconds the graphing engine can run. If set to 0, no time limit exists. |
| Path to dot.exe | The path to the dot executable if Graphviz is not installed/not available via the PATH environment variable. |
Worksheet Settings
'data' Worksheet
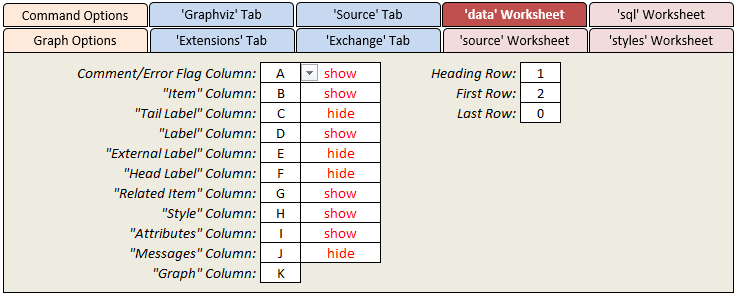
These settings allow you to rearrange the column layout of the data worksheet, and restrict which rows get processed.
| Setting | Description |
|---|---|
Comment/Error Flag Column | The column used to place '#' comment characters which indicate that the rows should be treated as a comment and not be included in the data to be graphed. This column also serves a second purpose when errors are found in the data. An exclamation point "!" character is placed in the column to signal an error, and direct you to look in the Messages column for the cause of the error. |
Item Column | The column within the 'data' worksheet where the Item values are located. |
Label Column | The column within the 'data' worksheet where the Label values are located. |
External Label Column | The column within the 'data' worksheet where the External Label values are located. |
Tail Label Column | The column within the 'data' worksheet where the Tail Label values are located. |
Head Label Column | The column within the 'data' worksheet where the Head Label values are located. |
Related Item Column | The within the 'data' worksheet column where the Related Item values will be found |
Style Name Column | The Column within the 'data' worksheet where the Style Name name values are located. |
Attributes Column | The column within the 'data' worksheet where the Attributes style attributes are located. |
Messages Column | The column located within the 'data' worksheet where error messages are to be written to. |
| Heading Row | The row containing the column headings |
| First Row | First row of data. |
| Last Row | Last row of data definitions. When set to 0 all rows after the First Row containing data are used. First Row and Last Row are useful during graph development for specifying a subset of data to process when the overall amount of data is large. |
'source' Worksheet
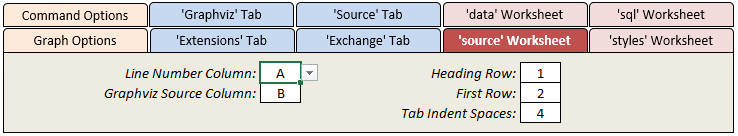
These settings allow you to rearrange the column layout of the source worksheet.
| Setting | Description |
|---|---|
Line Number Column | The column which contains the line number of the Graphviz DOT source code. |
Graphviz Source Column | The column where the Graphviz DOT source code gets placed |
| Heading Row | The row containing the column headings |
| First Row | First row of data. |
| Tab Indent Spaces | The number of blanks to insert based upon the depth of subgraphs within the graph. |
'sql' Worksheet
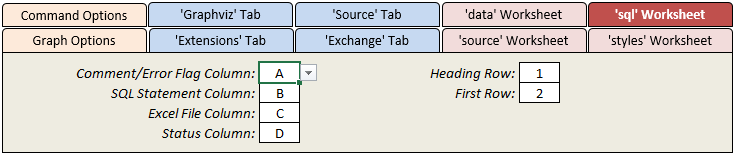
These settings allow you to rearrange the column layout of the sql worksheet, and restrict which rows get processed.
| Setting | Description |
|---|---|
Comment/Error Flag Column | The column used to place '#' comment characters which indicate that the rows should be treated as a comment and not be included in the set of SQL statements which get executed. |
SQL Statement Column | The column containing the SQL SELECT statements to execute |
Excel File Column | The column containing the paths to the Excel files containing the data which the SQL SELECT statements should be executed against. |
Status Column | The column where the status (Success/Failure/Skipped) of the SQL SELECT statement, along with any error messages is written to. |
| Heading Row | The row containing the column headings |
| First Row | First row of SQL SELECT statements to execute. |
'styles' Worksheet
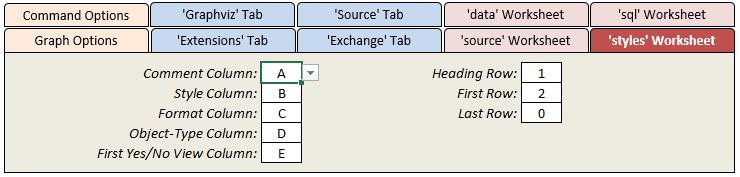
The 'styles' Worksheet' settings allow you to rearrange the column layout of the styles worksheet, and specify the range of rows to be included in the style collection at run-time.
| Setting | Description |
|---|---|
Comment Column | The column used to place '#' comment characters which indicate that the rows should be treated as a comment and not be included in the set of styles. |
Style Column | The column where the name of the style is specified |
Format Column | The column where the node, edge, or cluster format string is specified. |
Object-Type Column | The column where the object-type is specified. The object-type is used to classify the style as a node, edge, subgraph-open, subgraph-close, keyword, or native type. |
First Yes/No View Column | The first column containing Yes/No switches which control which styles will comprise the view. |
| Heading Row | The row which contains the column headings. The heading value of the "Yes/No Switch Column" is included in the graph's file name after the file name prefix. |
| First Row | First row of style definitions (i.e., where the definitions begin) |
| Last Row | Last row of style definitions. When set to 0 all rows after the First Row containing data are used. |
Ribbon Tab Settings
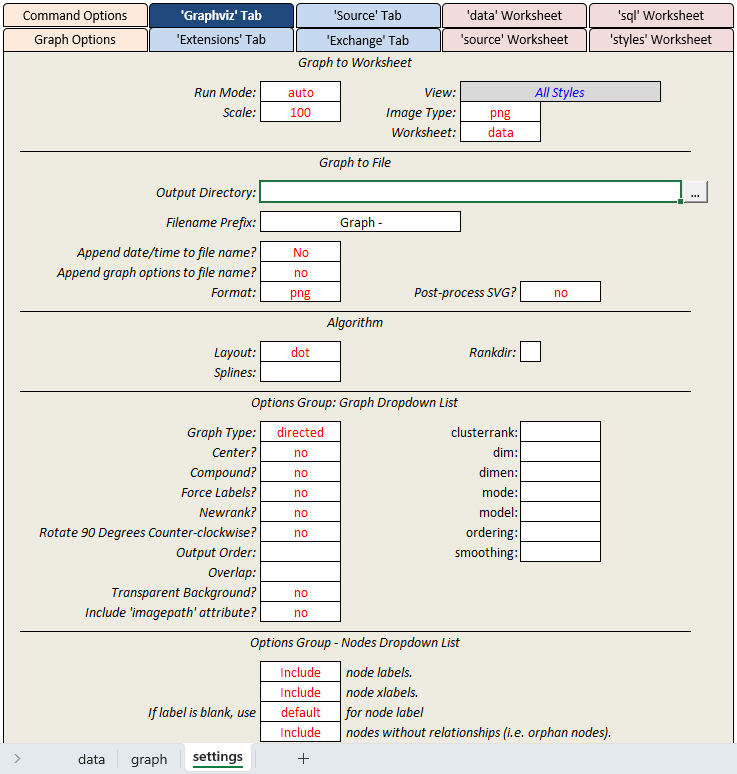
'Graphviz' Tab
This worksheet stores the selected values from the Graphviz ribbon tab. By saving these settings in a worksheet, the Relationship Visualizer can retain your choices across sessions, ensuring that your preferred layout, styling, and rendering options persist each time you reopen the workbook.
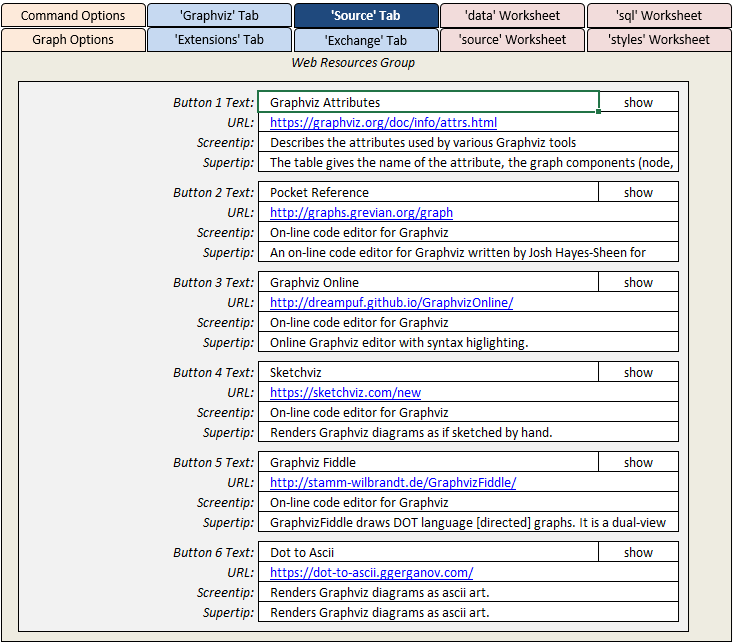
'Source' Tab
This worksheet stores the six web resources that appear as clickable links on the Source ribbon tab. The default URLs are suggestions provided by the Relationship Visualizer’s author, but you are free to replace them with your own preferred resources. Updating the links here ensures that the corresponding buttons on the Source tab always open the destinations you choose.
Typical substitutions include links to DOT language references, Graphviz attribute documentation, example galleries, internal documentation pages, or any external resources you find helpful while reviewing or editing the generated source code.
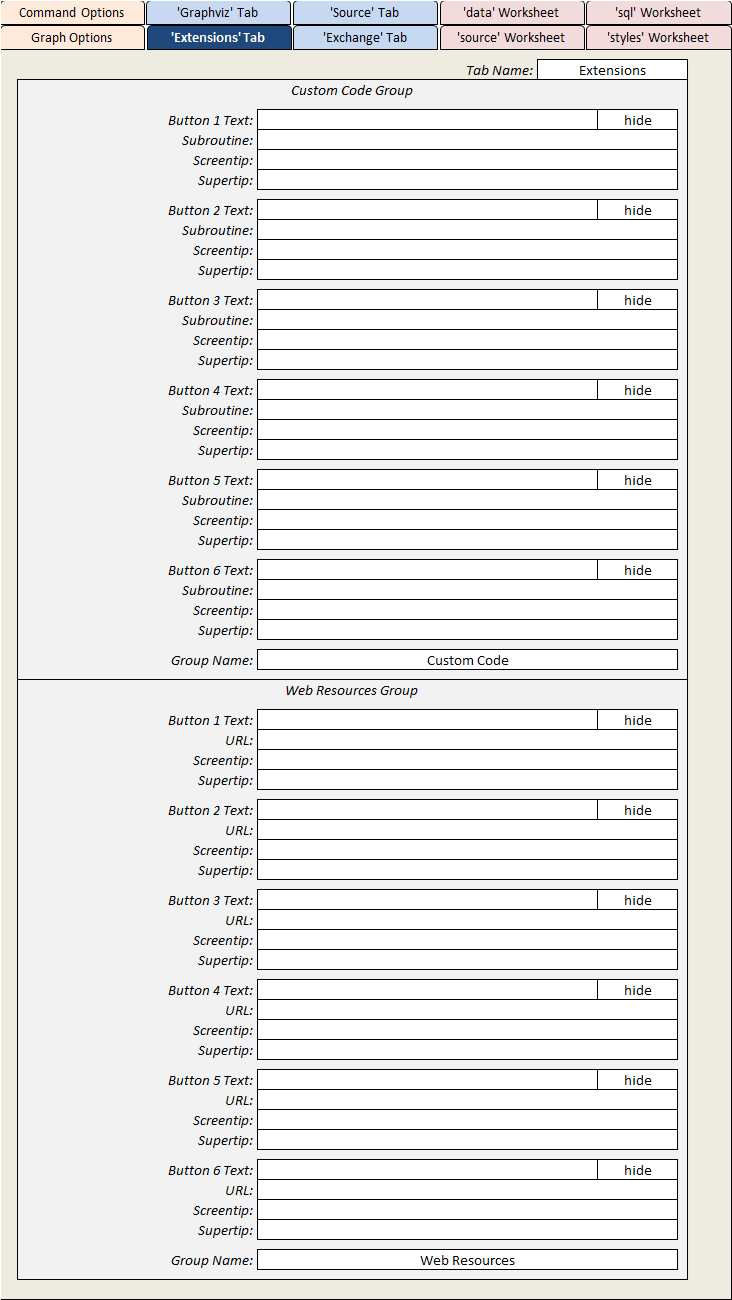
'Extensions' Tab
The Extensions worksheet is a seldom‑used but powerful feature designed for expert users. It provides a way to add custom VBA procedures to the workbook and launch them from the Ribbon without needing to understand the details of Ribbon XML or callback authoring. The feature supports up to six custom action buttons and six custom URL links.
A sample workbook demonstrating how to configure and use Extensions is included in the directory of examples.
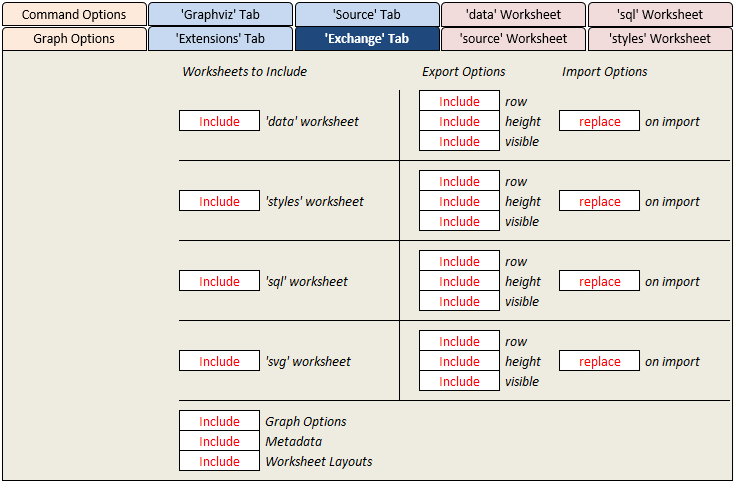
'Exchange' Tab
This worksheet stores the selected values from the Exchange ribbon tab. By saving these settings in a worksheet, the Relationship Visualizer can retain your choices across sessions, ensuring that your preferred export, import, and workbook options persist each time you reopen the workbook.
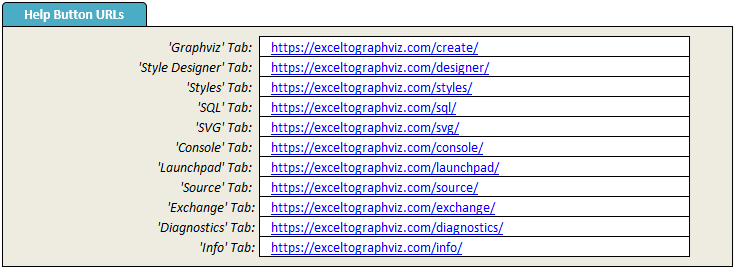
Help Button URLs
The Help Button URLs worksheet defines the links used by the Help buttons on the various Ribbon tabs. Each row maps a specific Ribbon control to the URL that should open when the user selects its Help button.
This worksheet allows you to manage all Help destinations in one place. Updating a URL here ensures that the corresponding Help button on the Ribbon will always direct users to the correct documentation page, tutorial, or reference material.