
Exploring diagrams just got easier
A new tool bar, fit-to-window controls, and pan-and-drag features have been added to the SVG viewer.
 jjlong150
A new tool bar, fit-to-window controls, and pan-and-drag features have been added to the SVG viewer.
jjlong150If you've ever generated a Graphviz diagram from a big Excel dataset with a few hundred rows of relationships, dependencies, or connections, you've probably run into the same problem I did: the resulting diagram is correct, but it's also enormous. Zoomed out far enough to see the whole thing, every label is unreadable. Zoomed in far enough to read anything, you've lost all sense of where you are.
Relationship Visualizer Version 11.0 includes a set of enhancements aimed squarely at that problem, built directly into the SVG files it exports without a separate viewer, plugins, or anything to install. Open the SVG file in a browser and it's already there.
| New SVG Viewer |
|---|
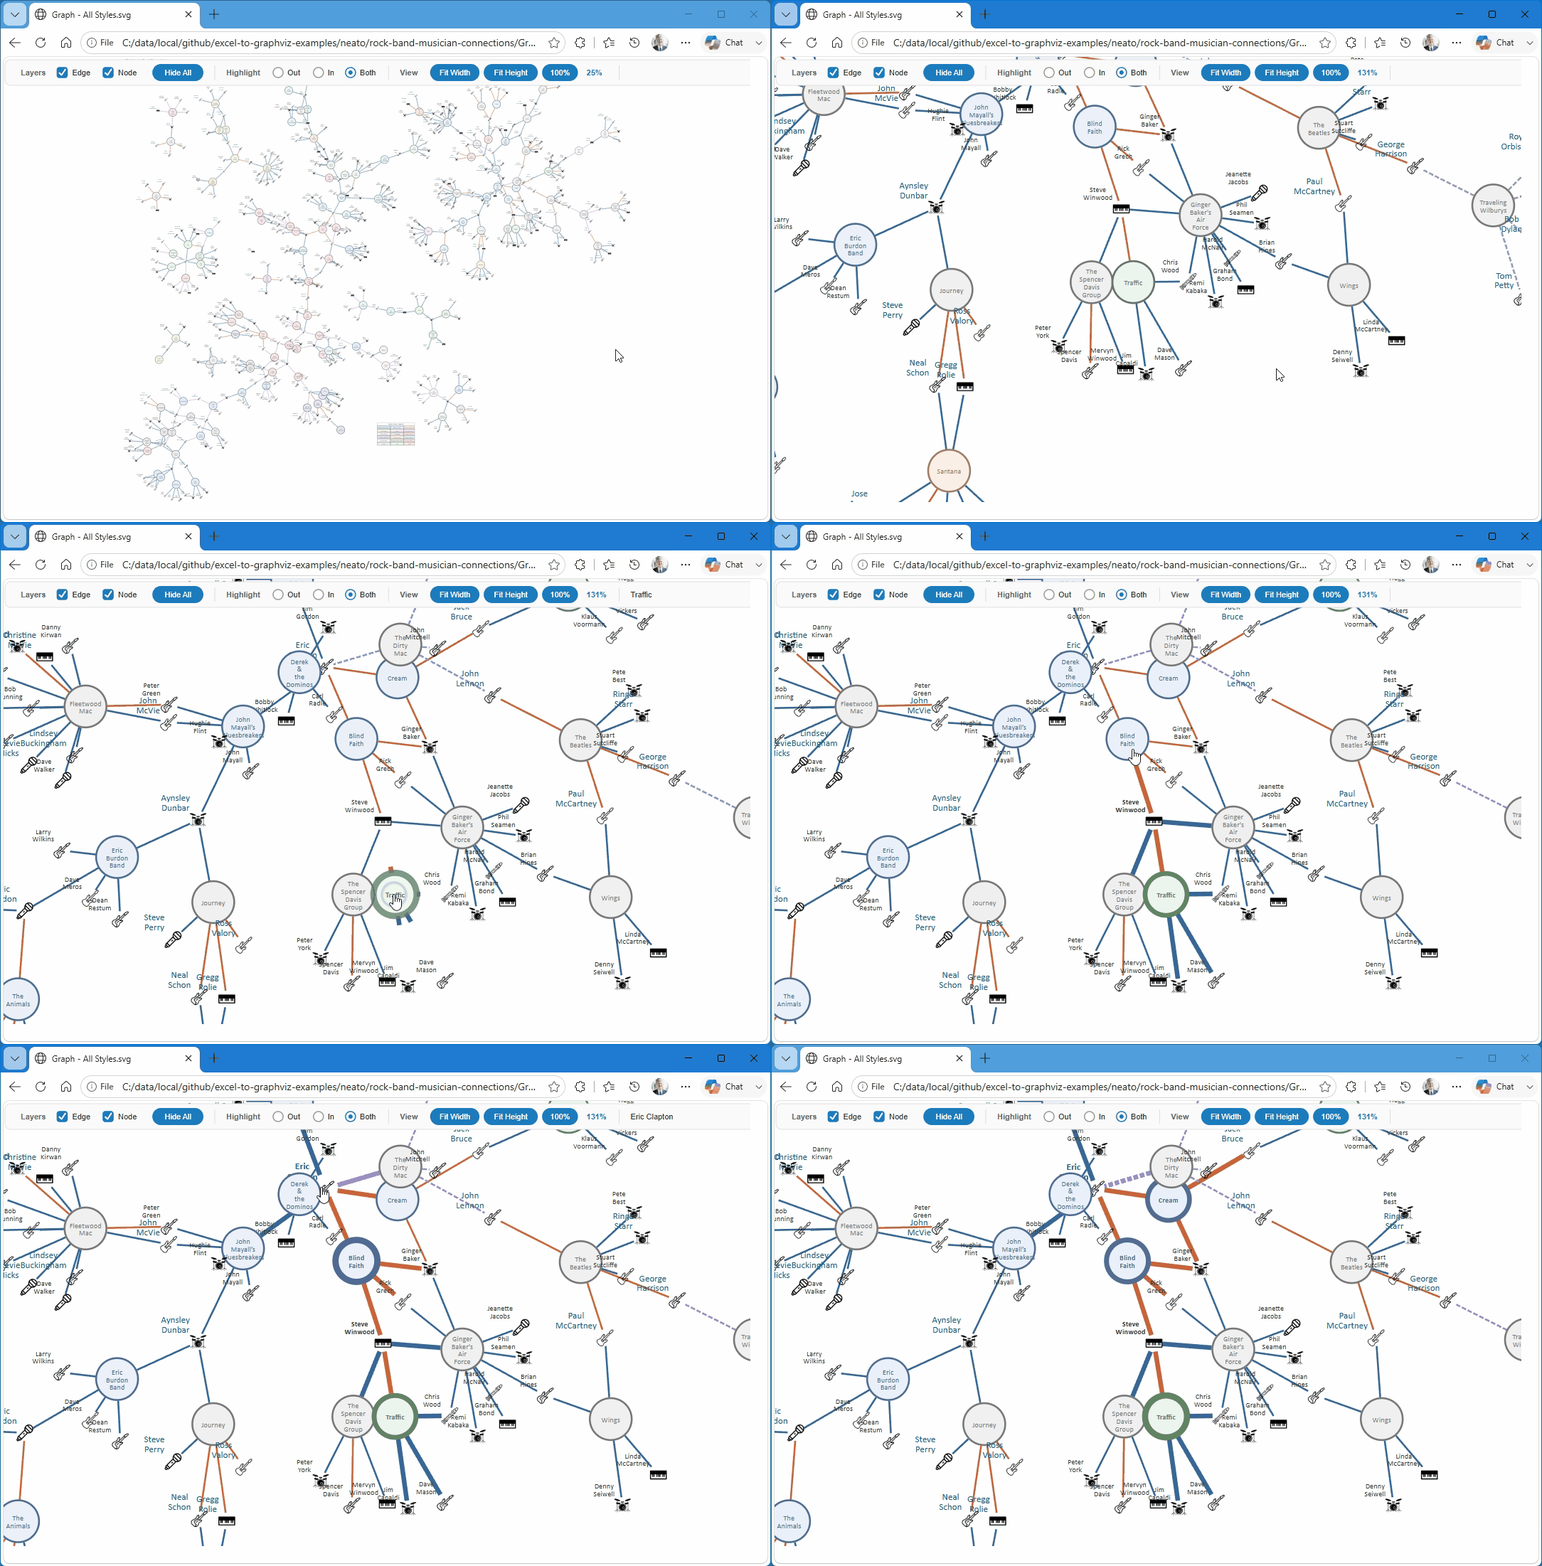 |
The core idea is simple: controls that stay where you put them, at a size you can actually use, no matter how far you've zoomed into the diagram itself. Sounds obvious. Getting there was less obvious. SVG has no built-in concept of "stay fixed on screen while everything else zooms," so the toolbar, the zoom-percentage readout, and the small zoom buttons on each cluster all had to be taught to counteract the diagram's own zoom in real time. The payoff is that a 500-node diagram and a 5-node diagram now feel like the same tool, just at different scales.
A few things came out of that same foundation:
Beyond navigation, the toolbar also lets you toggle entire categories of elements on and off. You can hide every edge and just look at nodes, say, or isolate one cluster. Click any node to highlight its connections, choosing whether you want to see what feeds into it, what flows out of it, or both.
All of this comes from an optional feature called SVG postprocessing, which injects the interactive layer into your exported diagrams. It's powerful, and like anything that injects code into a file, it's worth understanding before you turn it on — especially on a workbook other people will also be exporting from. We've written up exactly what it does and doesn't do in our security documentation, and the feature ships off by default with a confirmation step when you enable it.
If you're already using Relationship Visualizer, turn on postprocessing in on the SVG tab, then publish an SVG diagram; the new toolbar will be there automatically. Full details are in the Post-Process SVG Files guide.
I'd like to hear what you think, especially if you're working with diagrams in the hundreds-of-nodes range as that's exactly the case this was built for.